Figures & data
Figure 1. Subtype proportions and host species distributions of AIVs in Guangdong province, China. (A) AIV-positive rates between 2017 and 2019. (B) Proportions of AIV subtypes in samples from different poultry species. The numbers of oropharyngeal swabs collected from chickens, quails, ducks, pigeons, partridges, and geese were 1162, 201, 163, 79, 33, and 10, respectively.
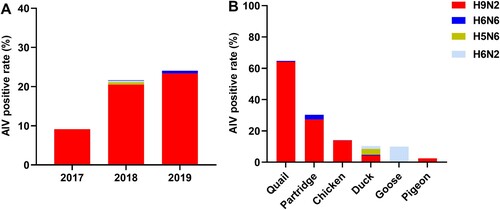
Figure 2. Phylogenetic analyses of H9N2 AIVs. (A) Host distribution of BJ/94-like and G1-like viruses; different colors represent different hosts. (B) Phylogenetic tree showing the HA (left) and NA (right) genes of the isolated H9N2 AIVs. 165 and 145 HA genes belonged to the BJ/94-like and G1-like lineages respectively. 207 and 103 NA genes belonged to the BJ/94-like and G1-like lineages, respectively. Red represents the BJ/94-like lineage and blue represents the G1-like lineage. Gray lines connect the HA and NA genes of the same isolate. (C) Host distribution of different genotypes at different LPMs; different colors represent different hosts.
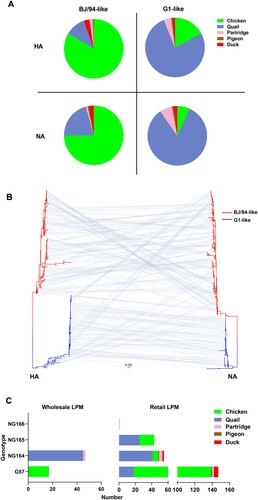
Figure 3. Schematic of evolutionary pathways of isolated H9N2 AIVs. The eight gene segments (depicted using horizontal bars from the top to the bottom of the virion) encode: basic polymerase 2 (PB2), basic polymerase 1 (PB1), acidic polymerase (PA), HA, nucleoprotein (NP), NA, matrix (M), and nonstructural protein (NS); different colors represent different viral lineages and the arrow thickness is the approximate number of H9N2 isolates in each pathway.
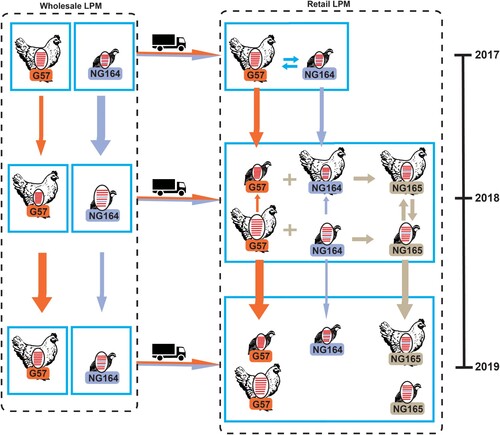
Table 1. Sequence identities of H9N2 AIVs isolated at different LPMs.
Figure 4. Antigenic cartography representation of HI data generated using a panel of antisera. Detailed HI data are presented in Table S2. The map was produced using AntigenMap (http://sysbio.cvm.msstate.edu/AntigenMap). One unit (cell) represents a two-fold change in the HI assay result.
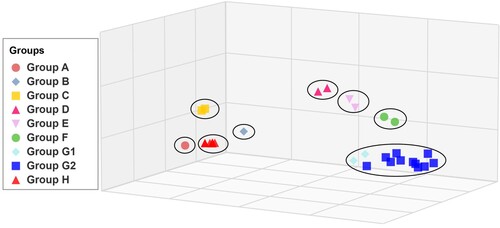
Figure 5. Replication and transmission of G57 viruses in chickens and quails. The viral titers of G57 H9N2 AIVs were recovered from chicken or quail trachea (A and B, respectively) and lungs (C and D, respectively). Groups of six chickens or quails were inoculated with 106 EID50 of the indicated virus; tracheal swabs from three chickens or quails per group were taken at 3, 5, and 7 dpi and lungs were harvested from chickens or quails at 3 dpi for viral titration. All data are representative or presented as the mean ± standard deviation of the mean (SEM) of three independent experiments, unless specified otherwise. Statistical significance relative to Ck/ZJ/HJ/07 or Ck/BJ/xy1125/14 was assessed using two-way ANOVA (*P < 0.05, **P < 0.01).
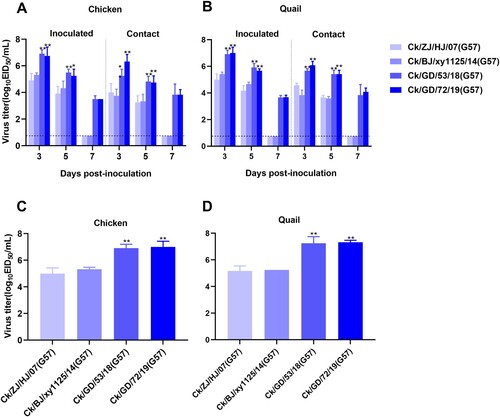
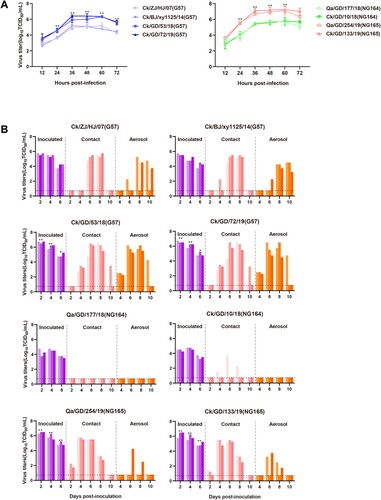
Figure 6. Replication and transmission of NG166 and NG184 viruses in chickens and quails. The viral titers of H9N2 AIVs were recovered from chicken or quail trachea (A and B, respectively) and lungs (C and D, respectively). Groups of six chickens or quails were inoculated with 106 EID50 of the indicated virus; tracheal swabs from three chickens or quails per group were taken at 3, 5, and 7 dpi, and lungs were harvested from chickens or quails at 3 dpi for viral titration. All data are representative or presented as the mean ± standard deviation of the mean (SEM) of three independent experiments, unless specified otherwise. Statistical significance relative to Qa/GD/177/18 or Ck/GD/10/18 was assessed using two-way ANOVA (*P < 0.05, **P < 0.01).
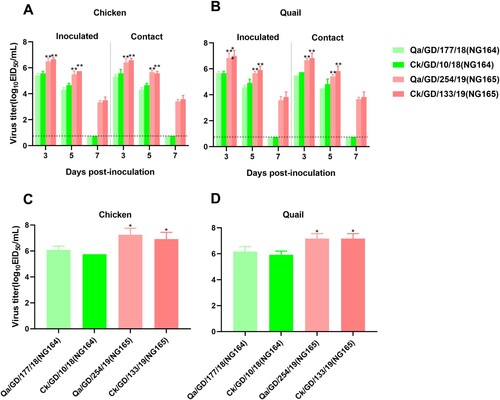
Figure 7. Mammalian adaptation of isolated H9N2 viruses. (A) Multistep growth curves of H9N2 AIVs in A549 cells inoculated at an MOI of 0.01. (B) Horizontal transmission and respiratory droplet transmission of H9N2 AIVs in ferrets; the dashed lines indicate the lower limit of viral detection. At 1 dpi, one inoculated ferret was moved to a clean isolator containing a naive ferret for direct contact. Another naive ferret was placed in the same isolator but separated so that no direct contact was possible, with transmission instead only permissible via the aspiration of aerosol droplets. To monitor viral shedding, nasal washes were collected from all animals every other day for 14 days. In cases when no virus was isolated from any of the three ferrets, no data were displayed. Each color bar represents the viral titer of an individual animal. All data are representative or presented as the mean ± standard deviation of the mean (SEM) of three independent experiments. Statistical significance relative to Ck/ZJ/HJ/07 and Ck/BJ/xy1125/14 or Qa/GD/177/18 and Ck/GD/10/18 was assessed using two-way ANOVA (*P < 0.05, **P < 0.01).