Figures & data
Figure 1. Topological and genetic reconciliation of Mamastrovirus genus. (A) Representation of PAirwise Sequence Comparison (PASC) results obtained from the frequency distribution of pairwise distances for all 521 sequences using the SDT analysis (Supplementary material Figure S2). Cut-off values for each genetic division are indicated, denoting groupings of the same genotype level at 35% and different species values higher than 45%. (B) Genetic distances for seven main lineages obtained when grouping the strains into each redefined designation, now as distinctive species within the Mamastrovirus genus. (C) Maximum likelihood tree based on the whole genome of all 521 non-redundant genomes available at GenBank, the best-fitted model to infer the phylogenetic relationship used was the SYM + R10; the red dots indicate the seven main lineages with a genetic distance higher than 45% (Supplementary material Figure S1).

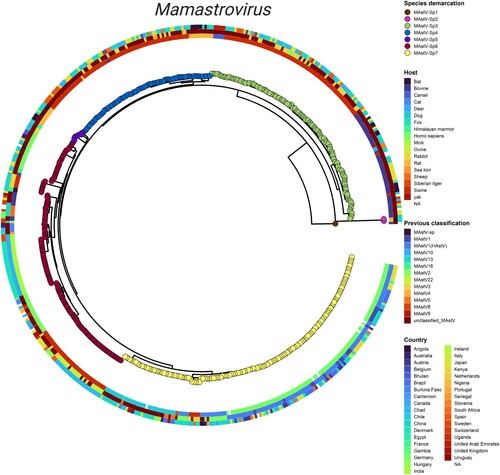
Figure 2. Integrated phylogeny for the Mamastrovirus genus. Visualization of the summarized phylogenetic tree of Mamastrovirus based on whole genomes and reconciled by the PASC distribution and genetic distances. Demarcation of the species proposed in the current study (tips), host of isolation (inner ring), previous classification of species (second ring), and geographic distribution (outer ringer) are all indicated in the phylogeny. Integration of the panels was performed by using the ggtreeExtra R package.

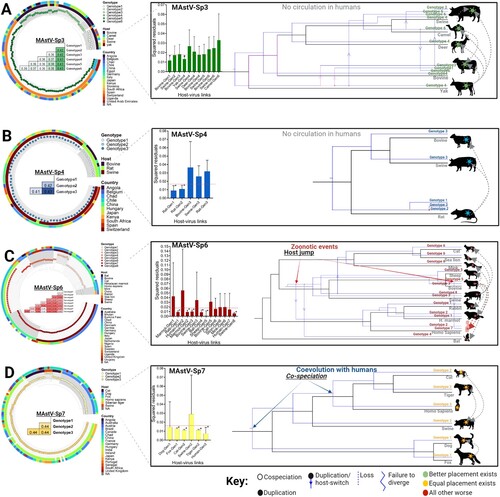
Figure 3. Genotypic demarcation of mamastrovirus species in relationship to their host and evolutionary reconstruction. (A-D) (left panels) Phylogenetic trees based on the whole genomes of MAstV-Sp3, MAstV-Sp4, MAstV-Sp6, and MAstV-Sp7 species, reconciled by the PASC distribution and the genetic distances (coloured table merged into the phylogenetic tree). Different genotypes (grey shading in each defined cluster and tips of the tree) for each species, host of isolation (inner ring) and geographic distribution (outer ringer) are all indicated in the phylogeny. (A-D) (right panels) Contributions of each host-virus (at the genotype level) link to the procrustean fit (centre)-jackknifed squared residuals (bars) and the upper 95% confidence intervals (error bars) resulting from applying PACo to patristic distances. Links supported among the mamastrovirus genotypes and their respective hosts are indicated by an asterisk (*). The MSQR values obtained for each viral species is represented by a red-dashed line. Resolution of the mamastrovirus phylogeny with their hosts is based on the methodology implemented in JANE. All possible codivergence, extinction, host-jumping, and lineage duplication events are described in the JANE Manual (see Supplementary Material Figures S3-S6 for clarification). A summary of the most relevant events linked to host-switch are denoted with grey dashed arrows. Host-jump events into the human population are denoted as zoonotic events. Co-speciation between MAstV-Sp7G3 (which included all the previous classified human astroviruses) and the human population is also denoted. For host species in which a genotype-host link was supported by the procrustean fit, those acting as the donor host during the jump events are located at the beginning of the arrows.

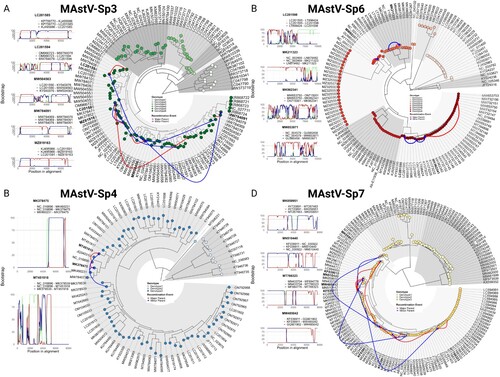
Figure 4. Mamastrovirus recombination is restricted to within intra-genotypic boundaries. Panels display recombination events detected by RDP5v5 software in (A) MAstV-Sp3, (B) MAstV-Sp4, (C) MAstV-Sp6, and (D) MAstV-Sp7. Events were supported by at least three detection methods and a statistical significance of p < 0.01 after Bonferroni correction (see Supplemental information Table S3), but for simplicity, only Bootscan analysis results are shown where breakpoints had a clear signal and bootstrap values of 75% or higher were obtained (left). The major-parent, minor-parent, and recombinant sequences are mapped onto the phylogenetic tree for each species (right). Major-minor parent interactions are denoted in green, major parent-recombinant strain interactions in red, and minor parent-recombinant strain interactions in blue (left panels).

Figure 5. Evolutionary history of mamastroviruses infecting humans. (A) Time-calibrated maximum clade credibility (MCC) trees for both mamastrovirus species identified as circulating in the human population (left: MAstV-Sp6; right: MAstV-Sp7). Time-resolved phylogenies show the time for the most recent common ancestor (tMRCA) and the evolutionary rates for the genotypes circulating in humans. Host and clinical manifestations observed in the genotypes of interest are denoted. For MAstV-Sp7G3 the groups previously defined by Zhou et al. [Citation8] are denoted, the most recent demographic expansion of Group I is indicated by a red arrow. (B) (left panel) Demographic history of three human mamastrovirus genotypes inferred via Bayesian skyline plot (BSP) with coalescent tree prior and an exponential, uncorrelated clock model. The shading represents the 95% highest posterior density (HPD) of the product of generation time (τ) and effective population size (Ne). The line tracks the inferred median of Neτ. (right panel) Zoomed-in ML-phylogeny for the MAstV-Sp6 genotype 7 which includes the previously classified VA1/UK clade. Colour codings are embedded into the phylogeny to indicate tropism (inner), country of isolation (middle) and host (outer) where known.
![Figure 5. Evolutionary history of mamastroviruses infecting humans. (A) Time-calibrated maximum clade credibility (MCC) trees for both mamastrovirus species identified as circulating in the human population (left: MAstV-Sp6; right: MAstV-Sp7). Time-resolved phylogenies show the time for the most recent common ancestor (tMRCA) and the evolutionary rates for the genotypes circulating in humans. Host and clinical manifestations observed in the genotypes of interest are denoted. For MAstV-Sp7G3 the groups previously defined by Zhou et al. [Citation8] are denoted, the most recent demographic expansion of Group I is indicated by a red arrow. (B) (left panel) Demographic history of three human mamastrovirus genotypes inferred via Bayesian skyline plot (BSP) with coalescent tree prior and an exponential, uncorrelated clock model. The shading represents the 95% highest posterior density (HPD) of the product of generation time (τ) and effective population size (Ne). The line tracks the inferred median of Neτ. (right panel) Zoomed-in ML-phylogeny for the MAstV-Sp6 genotype 7 which includes the previously classified VA1/UK clade. Colour codings are embedded into the phylogeny to indicate tropism (inner), country of isolation (middle) and host (outer) where known.](/cms/asset/854bd05c-2dd6-4c10-a47f-0a78edc24bd0/temi_a_2217942_f0005_oc.jpg)
Table 1. BETS analysis comparing the fit to the data of two models (heterochronous) the constrained model (isochronous).
Supplemental Material
Download Zip (1.1 MB)Data availability
Accessions with relevant metadata are contained in Supplemental Tables S1 and S2. Scripts for generating figures are available upon request. Raw data files for the analysis of coevolutionary analysis using PACo, JANE and the temporal analysis using BEAST are available on Github at https://github.com/LesterJP/Temporal-and-coevolutionary-analyses-reveal-the-events-driving-the-emergence-and-circulation-of-huma.
