Figures & data
Table 1. List of vaccine-escape mutations defined according to in vivo and in vitro studies.
Table 2. Patients’ characteristics.
Figure 1. Percentage of patients with at least one vaccine escape mutation across HBV genotype D sub-genotypes and prevalence of vaccine escape mutations. The histogram in panel A reports the percentage of patients harbouring ≥1 vaccine escape mutation stratified according to the different HBV D sub-genotypes identified in the study population. As reported, HBV sub-genotype D3 is characterized by the highest percentage of patients with ≥1 vaccine escape mutation compared to the other D sub-genotypes. Statistically significant differences were assessed by Chi-Squared test based on 2 × 2 contingency table. The histogram in panel B reports the prevalence of each identified vaccine escape mutation within the population of patients harbouring ≥1 vaccine escape mutation (N = 168).
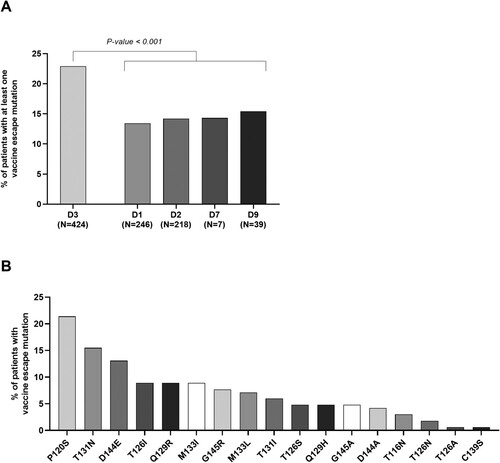
Table 3. Multivariable analysis of parameters associated with the presence of at least one vaccine escape mutation.
Figure 2. Temporal trend of circulation for complex profiles of vaccine escape mutations. The histogram reports the percentage of patients with complex profiles of vaccine-escape mutations defined as the presence of >2 vaccine escape mutations in the 3 analysed time windows: 2005–2009, 2010–2014, 2015–2019. Statistically significant difference was assessed by Chi-square for trend based on 3 × 2 contingency table.
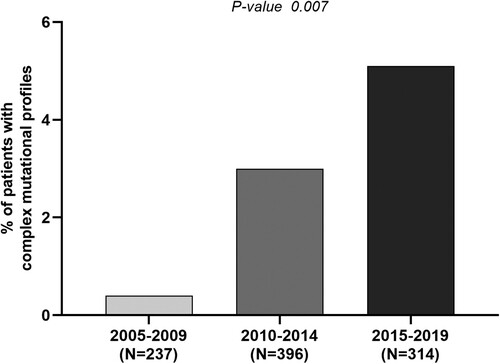
Table 4. Multivariable analysis of parameters associated with the presence of complex mutational profiles.
Figure 3. Virological parameters characterizing patients with complex mutational profiles. Box plot in (A) reports the distribution of serum HBsAg observed in the group of patients with complex profiles of vaccine-escape mutations (N = 29), with a single vaccine-escape mutation (N = 139) and with no vaccine escape mutations (N = 779). Statistically significant differences were assessed by Mann–Whitney Test. The histogram (B) reports the percentage of patients with HBsAg negativity despite detectable HBV-DNA in the afore-mentioned 3 subgroups of patients. Statistically significant differences were assessed by Chi-squared Test. Box plot in (C) reports HBV-DNA levels observed in the groups of patients with complex profiles of vaccine-escape mutations (N = 18), with a single vaccine-escape mutation (N = 55) and with no vaccine escape mutations (N = 353). The analysis has been restricted to drug naïve patients. Statistically significant differences were assessed by Mann–Whitney Test.
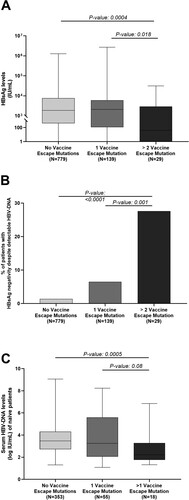
Figure 4. Intra-patient prevalence vaccine escape mutations according to NGS analysis. The graph reports the intra-patient prevalence of the identified vaccine escape mutations in a subset of the patients, in which HBsAg region was analysed by NGS (N = 32). Intra-patient prevalence was expressed as percent of reads with the specific vaccine escape mutation respect to the total reads obtained for each patient. Mutations under the bottom dotted line in the graph are those with an intra-patient prevalence <20% (minority species) not detected by standard population-based sequencing. Mutation above the upper dotted line in the graph are those with an intra-patient prevalence >90% indicating their full fixation in viral quasispecies.
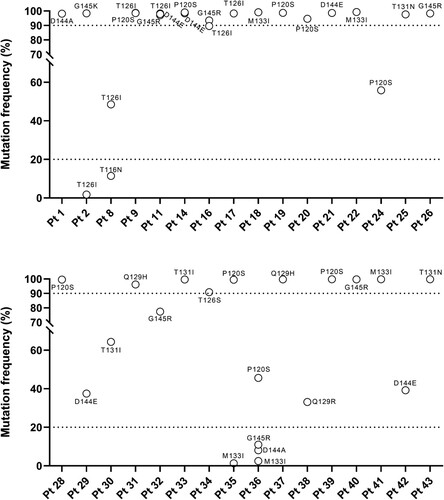
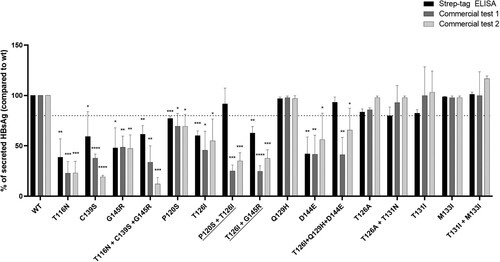
Figure 5. In vitro impact of vaccine escape mutation on HBsAg secretion and diagnostic antigenicity. A plasmid encoding HBsAg linked to a streptavidin-tag version II at N-terminus was used to transfect the Huh7 cells. The amount of strep-tagged HBsAg released in culture supernatants was then quantified using a specifically-designed ELISA capable to recognize the Strep-tag linked to the HBsAg (black bars) and using two commercial assays targeting HBsAg (dark grey for commercial assay 1 and light grey for commercial assay 2). For each mutant, the amount of strep-tagged HBsAg released in supernatants of Huh7 cell cultures was expressed as percentage, considering the amount of the wild-type strep-tagged HBsAg as 100%. Results represent the mean values (+/- standard deviation) of 2 independent experiments, each led in triplicate. * indicates P values ranging from 0.05 to 0.01, ** P values from 0.01 to 0.001 and *** P values <0.001 compared to wild-type. For the underlined complex mutational profiles, HBsAg release was significantly lower than that observed for the single mutation (P120S and G145R, P-value = 0.04 for both). These statistically significant differences were observed only for commercial assay 1.