Figures & data
Figure 1. Mean annual prevalence of WNV antibodies in common coots sampled between 2003 and 2020. Bars indicate seroprevalence per year while the number of individuals analysed each year is indicated in the numbers above bars.
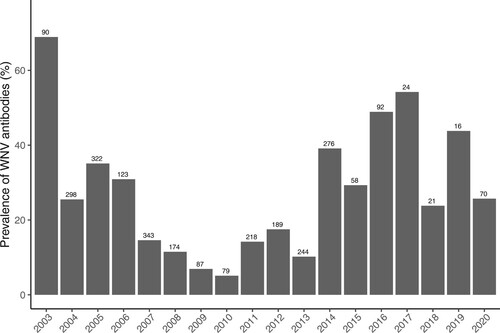
Figure 2. Odds ratios plot with 95% confidence intervals showing the ratio of odds between seasons (winter, spring, summer and autumn) and between age classes (juveniles and adults). The blue dotted line represents the statistical probability (p) that the odds ratio equals 1.
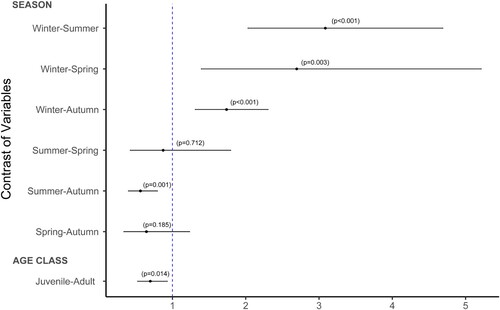
Figure 3. Scatter plot showing the relationship between mean maximum temperature in winter (green), mean temperature in spring (blue) during sampling period in year. The grey shaded area represents the smoothed trend with a span of 0.5.
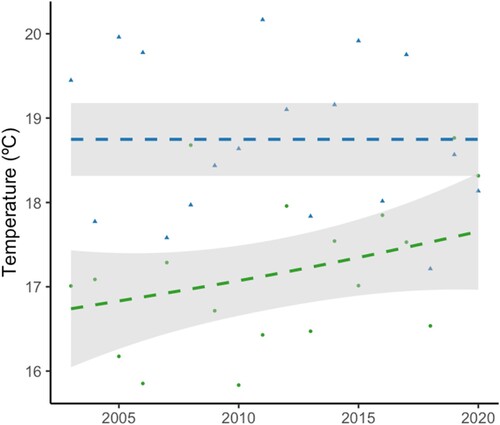
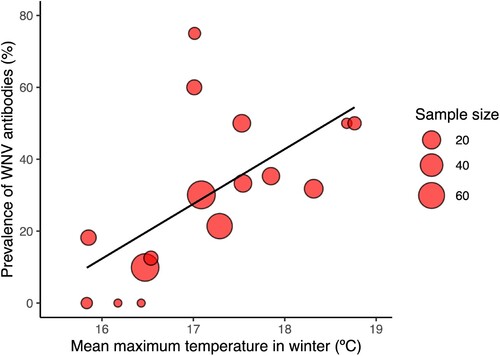
Figure 4. Bubble plot showing the relationship between the prevalence of WNV antibodies (%) and mean maximum temperature in winter. The size of the cycles is proportional to the number of juvenile common coots tested.