Figures & data
Figure 1. Diffusion of Ebola VLPs in pH-neutralized human CVM that is untreated or treated with ZMapp. (A) Representative traces with effective diffusivities within 1 standard error of the mean of the ensemble average at a time scale of 0.2667 s (B) Ensemble-averaged geometric mean square displacements (MSD) as a function of timescale. Statistical significance is evaluated by two-way repeated measures ANOVA with correction by Holm-Šidák test. (C) Ensemble-averaged geometric Deff at a timescale of 0.2667 s for individual CVM specimens, with geometric mean and standard deviation indicated by solid lines. Statistical significance is evaluated by repeated measures mixed effects analysis with correction by Holm-Šidák test on log-transformed data. (D) Fraction of fast-moving particles (average 〈Deff〉 ≥ 0.347 µm2/s, capable of crossing a 50 µm mucus barrier within 1 h) with geometric mean and standard deviation indicated by solid lines. Evaluated by repeated measures mixed-effects analysis followed by Holm-Šidák test. (E) Estimated time for 50% and (F) 10% of pseudovirus particles to diffuse through a 50 µm layer. Data represent the ensemble-averaged mean of samples in each treatment. Error bars represent the standard error of the mean. Evaluated by repeated measures mixed-effect analysis on log-transformed data with correction by Holm-Šidák test (****p < 0.0001).
Figure 2. Diffusion of Ebola VLPs in pH-neutralized CVM that is untreated or treated with ZMapp, segregated by whether ZMapp induced a statistically significant reduction in the fast-moving populations of Ebola VLPs in CVM from the same donor. (A) Fraction of fast-moving virus (average 〈Deff〉 ≥ 0.347 µm2/s, capable of crossing a 50 µm mucus barrier within one hour in each donor with and without ZMapp treatment. Statistical difference is determined by two-way ANOVA followed by post-hoc uncorrected Fisher’s LSD test. (B) Ensemble-averaged geometric Deff at a timescale of 0.2667 s for Ebola VLPs in untreated and ZMapp-treated CVM within the same donors. (C) Fraction of fast-moving virus in untreated or ZMapp-treated CVM samples separated by trapping status. Statistical difference is determined by one-way repeated measures ANOVA corrected by post-hoc Sidak test. Solid lines represent geometric mean and standard deviation. (D) Ensemble-averaged geometric Deff at a timescale of 0.2667 seconds for Ebola VLPs in untreated or ZMapp-treated CVM samples separated by trapping status. Solid lines represent geometric mean and standard deviation. Trapping samples are those from donors with a significant decrease in fast-moving particles before and after treatment with ZMapp. Statistical difference is determined by one-way repeated measures ANOVA corrected by post-hoc Sidak test (*p < 0.05, **p < 0.01, ***p < 0.001, ****p < 0.0001).
Figure 3. Ab-mediated trapping of Ebola VLPs by Community State Type (CST). (A) Ensemble-averaged 〈Deff〉 or (B) percent fast-moving viruses (Deff ≥ 0.347 µm2/s) in pH-neutralized CVM treated or untreated with ZMapp. Samples are grouped by microbial CST. Samples were sequenced with 16s rRNA whole-genome sequencing analysis and classified into CSTs depending on the predominant microbial species, according to the following groups: Class I (L. crispatus, n = 34), Class II (L.gasseri, n = 3), Class III (L.iners, n = 3), Class IV (G.vaginalis, n = 5), or Class V (L.Jensenii, n = 3). Solid lines represent geometric mean and standard deviation. Statistical significance is measured by repeated measures mixed effects analysis with post-hoc Sidak test (***p < 0.001, ****p < 0.0001).
Figure 4. Ab-mediated Trapping of Ebola VLPs based on presence of substantial bacterial populations. (A) Ensemble-averaged 〈Deff〉 and (B) percent fast-moving viruses (〈Deff〉 ≥ 0.347 µm2/s) in CVM samples whose microbiome contained at least 5% of each bacteria, treated or untreated with ZMapp. (C) Ensemble-averaged 〈Deff〉 and (D) percent fast-moving viruses in pH-neutralized CVM, where samples are sorted according to whether the sum of L. Iners, G. Vaginalis, and other anaerobes composed greater than 5% of the sample’s bacterial population. Solid lines represent geometric mean and standard deviation. Analysis was performed by two-way ANOVA on log-transformed data with post-hoc Holm-Sidak’s test. (*p < 0.05, **p < 0.01, ***p < 0.001, ****p < 0.0001).
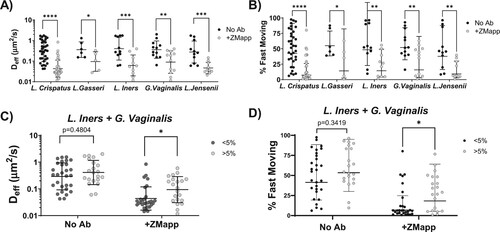
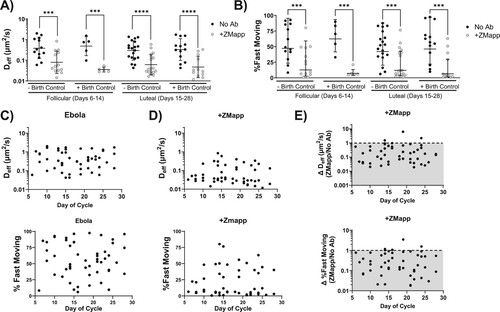
Figure 5. Effect of the menstrual cycle phase and birth control status on Ab-mediated trapping of Ebola VLPs in pH-neutralized CVM. Cycles were normalized to 28 days based on the donor reported number of days post-menses. CVM samples were grouped by the cycle phase and separated by birth control status. Samples classified as follicular phase were those collected 6–14 days post-menses, while those classified as luteal phase were from 15 to 28 days post-menses. (A) Average 〈Deff〉 of virions in follicular versus luteal phase in normally cycling versus donors on birth control. (B) Percentage of fast-moving virions (average 〈Deff〉 ≥ 0.347 µm2/s) by phase in follicular versus luteal phase in normally cycling versus donors on birth control. Solid lines represent geometric mean and standard deviation. Data were analysed using Two-Way repeated measures ANOVA with Sidak’s multiple comparisons test. A p ≤ 0.05 was considered statistically significant (***p < 0.001, ****p < 0.0001). (C) Average 〈Deff〉 and percent fast-moving of untreated Ebola VLPs in pH-neutralized CVM as a function of cycle day. (D) Average 〈Deff〉 and percent fast-moving of Ebola VLPs treated with ZMapp in pH-neutralized CVM as a function of cycle day. (E) Trapping effect size as a ratio of either average 〈Deff〉 or percent fast-moving virions in a treated sample over the untreated control. The dotted line represents the point at which there was no decrease in mobility in the antibody condition compared to control, with the shaded area representing a decrease in mobility upon addition of Ab. Data were analysed using Spearman’s Correlation. Alpha of p ≤ 0.05 was considered statistically significant; there was no relationship between trapping potency and cycle day.