Figures & data
Table 1. Baseline clinical and laboratory data for SLE patients and healthy control women.
Figure 1. [a] Box-whisker plot of serum IL-37 levels in SLE patients and healthy control women (HCW). The horizontal line inside the box indicates the median. Whiskers indicate interquartile range (IQR). Black circles indicate outliers. Mann-Whitney U test was used to assess significant difference (***p < 0.001). [b] Receiver operating characteristic (ROC) curve analysis of IL-37 in SLE patients versus HCW. AUC: area under the curve; CI: confidence interval; p: probability.
![Figure 1. [a] Box-whisker plot of serum IL-37 levels in SLE patients and healthy control women (HCW). The horizontal line inside the box indicates the median. Whiskers indicate interquartile range (IQR). Black circles indicate outliers. Mann-Whitney U test was used to assess significant difference (***p < 0.001). [b] Receiver operating characteristic (ROC) curve analysis of IL-37 in SLE patients versus HCW. AUC: area under the curve; CI: confidence interval; p: probability.](/cms/asset/5558771b-15f2-4ea4-9635-02a23ec0e997/teba_a_2336702_f0001_b.gif)
Table 2. Serum interleukin-37 levels stratified by characteristics of SLE patients.
Table 3. Association analysis of IL37 gene SNPs rs3811046 and rs3811047 with SLE risk.
Figure 2. Two-locus linkage disequilibrium (LD) plot for the IL37 gene variants rs3811046 G/T and rs3811047 A/G showing the LD coefficient (D’; 0.13; left) and correlation coefficient (R2; 0.01; right).
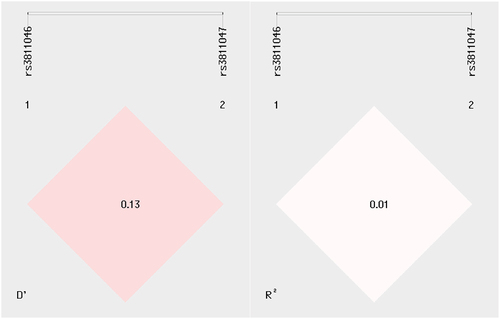
Table 4. Relationship of IL37 gene variants rs3811046 and rs3811047 to disease activity and lupus nephritis.
Figure 3. Box-whisker plot of serum IL-37 levels in SLE patients plus healthy control women stratified by genotypes of IL37 SNPs rs3811046 and rs3811047. The horizontal line inside the box indicates the median. Whiskers indicate interquartile range (IQR). Black circles indicate outliers. Mann-Whitney U test was used to assess significant difference (ns: not significant).