Figures & data
Figure 1. Structure and development of neoblasts. (A) (A-C) Schematic sections of platyhelminth embryo at early stage (A; cleavage, forming blastomeres), intermediate stage (B; embryonic primordium) and late stage (C; differentiated organs). “Neoblast progenitors” form a pool of scattered inner cells that remain mitotically active at a stage (B) when all other cells have exited the cell cycle and assemble into organ primordia; these progenitors become the definitive neoblasts of the late embryo that continue to add cells to growing tissues, and replace cells during adult life.
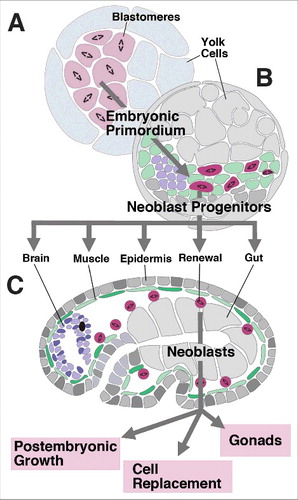
Figure 2. Postembryonic growth of Macrostomum lignano. (A, B) Z-projections of horizontal confocal sections of Macrostomum hatchling (A) and adult (B) pulsed for 30min with BrdU and fixed right thereafter. Preparations were labeled with antibody against BrdU (green) and tyrosinated tubulin (tyrTub; magenta). BrdU-labeled neoblasts form bilateral columnar populations of cells. (C-D’’) Z-projections of three consecutive horizontal confocal sections of specimen 3 days after hatching (D3; C-C’’) and 21 days after hatching (D21; D-D’’). Nuclei are labeled with Sytox (magenta in C, D; white in C’, C’’, D’, D’’); cilia and elongated processes of neurons and gland cells are labeled with anti-Tyrosinated tubulin (C, D; green). Z-projections represents central (“equatorial”) level of worm, defined by characteristic compartmentalization of brain neuropile into centro-medial domain (cm in D’), flanked by centro-lateral “wings” (cl in D’). Location, size and shape of nuclei allow one to distinguish several tissue layers, including epidermis (ep), parenchymal layer (muscle/glands; ms/gl), brain (br), nerve cords (nc), pharynx (ph) and gut. Individual nuclei of cells filling these layers in the z-projection presented in (C-D’’) are differentially colored (C’’, D’’). (E) Histogram showing average numbers of cells contained within horizontal section. For epidermis and muscle/gland layer, counts were started at the level of pharynx [arrow in (C’’, D’’)]. Abbreviations: br brain; cx cortex; ep epidermis; gl gland; ms muscle; nb neoblast; nc nerve cord; np neuropil; ph pharynx; Bar: 25μm.
![Figure 2. Postembryonic growth of Macrostomum lignano. (A, B) Z-projections of horizontal confocal sections of Macrostomum hatchling (A) and adult (B) pulsed for 30min with BrdU and fixed right thereafter. Preparations were labeled with antibody against BrdU (green) and tyrosinated tubulin (tyrTub; magenta). BrdU-labeled neoblasts form bilateral columnar populations of cells. (C-D’’) Z-projections of three consecutive horizontal confocal sections of specimen 3 days after hatching (D3; C-C’’) and 21 days after hatching (D21; D-D’’). Nuclei are labeled with Sytox (magenta in C, D; white in C’, C’’, D’, D’’); cilia and elongated processes of neurons and gland cells are labeled with anti-Tyrosinated tubulin (C, D; green). Z-projections represents central (“equatorial”) level of worm, defined by characteristic compartmentalization of brain neuropile into centro-medial domain (cm in D’), flanked by centro-lateral “wings” (cl in D’). Location, size and shape of nuclei allow one to distinguish several tissue layers, including epidermis (ep), parenchymal layer (muscle/glands; ms/gl), brain (br), nerve cords (nc), pharynx (ph) and gut. Individual nuclei of cells filling these layers in the z-projection presented in (C-D’’) are differentially colored (C’’, D’’). (E) Histogram showing average numbers of cells contained within horizontal section. For epidermis and muscle/gland layer, counts were started at the level of pharynx [arrow in (C’’, D’’)]. Abbreviations: br brain; cx cortex; ep epidermis; gl gland; ms muscle; nb neoblast; nc nerve cord; np neuropil; ph pharynx; Bar: 25μm.](/cms/asset/4c595390-f78b-460f-9605-6d02168cbe0d/kngs_a_1469944_f0002_oc.jpg)
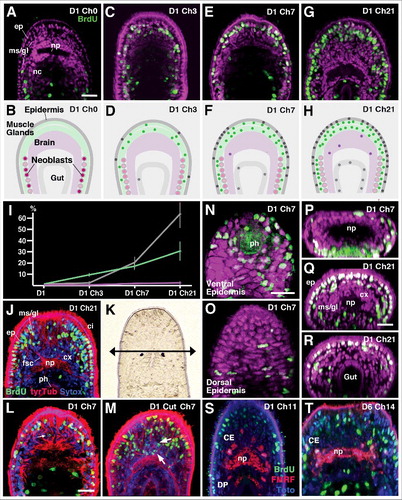
Figure 3. Incorporation of BrdU-positive (neoblast-derived) cells into tissue layers, following chase intervals of different lengths. Top row panels (A, C, E, G) show Z-projections of horizontal confocal sections representing central (“equatorial”) level of juvenile worms treated with 30min pulse of BrdU 1 day after hatching, and chased for 0 days (A; D1Ch0), 3 days (C; D1 Ch3), 7 days (E; D1 Ch7) and 21 days (G; D1 Ch21). BrdU-positive cells in green; all nuclei (labeled by Sytox) are in magenta. Second row panels (B, D, F, H) Schematic depictions of horizontal sections with tissue layers (epidermis, brain, muscle/gland, pharynx/gut) differentiated by different shading. Colored circles indicate pattern of BrdU-positive cells at represented chase intervals. (I) Ratio of BrdU-positive cells (in % of total) in different tissue layers at different chase intervals. (J) Representative confocal section of specimen chased for 21 days. Nuclei are in blue (Sytox), cilia and processes of neurons/glands in red (anti-Tyrosinated tubulin). (K) Dorsal view of head of hatchling, showing location of cut (arrow anterior to eyes). (L, M) Neoblast derived cells following BrdU pulse at day 1 in control (L) and following cut (M). Arrows point at BrdU-positive neurons in brain cortex. (N-T) Representative confocal sections of specimens chased for 7 days (N-P) or 21 days (Q, R). (N, O) are horizontal sections showing ventral epidermis, surrounding pharynx (ph; N) and dorsal epidermis (O). (P-R) are digitally tilted cross sections at level of brain (P, Q) and posterior gut (R). For 7 day chase (N-P) note abundance of BrdU-positive epidermal cells ventrally, compared to dorsally. After 21 day chase, anterior epidermis is almost completely filled with BrdU-positive cells (Q); posterior epidermis (R) contains far less BrdU-positive cells. (S, T) Z-projections of horizontal confocal sections of specimen chased for 11 days (S) or 14 days (T). Subset of neurons is labeled by antibody against FMRFamide (red); general nuclei are in blue (Sytox), BrdU-positive cells in green. Select FMRF-positive cells of central cluster (CE) have incorporated BrdU (arrowheads). Abbreviations: br brain; CE central cluster of FMRF neurons; cx cortex; ep epidermis; fsc fascicle; gl gland; ms muscle; nb neoblast; nc nerve cord; np neuropil; ph pharynx; Bars: 25μm (A-D; J; K-M; N-Q).