2,058
Views
8
CrossRef citations to date
0
Altmetric
Original Research Paper

Bisphenol A alters the self-renewal and differentiation capacity of human bone-marrow-derived mesenchymal stem cells

, , , , , , , & show all
Article: e1200344 | Received 27 Jan 2016, Accepted 01 Jun 2016, Published online: 13 Jul 2016

Figures & data

Figure 1. BPA enhances the proliferation of BMSCs. BMSCs treated with 100 nM or 1 μM BPA for 1 d or 5 d were seeded in a 96-well plate and analyzed on days 2, 4, and 7 by the MTT assay. Values represent triplicates and 3 independent experiments for each of the 3 donors. Bar ± SD. *, P < 0.05 relative to vehicle-treated BMSCs.
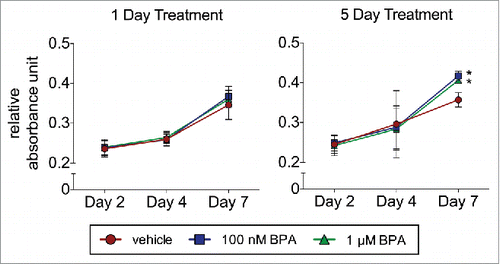
Figure 1. BPA enhances the proliferation of BMSCs. BMSCs treated with 100 nM or 1 μM BPA for 1 d or 5 d were seeded in a 96-well plate and analyzed on days 2, 4, and 7 by the MTT assay. Values represent triplicates and 3 independent experiments for each of the 3 donors. Bar ± SD. *, P < 0.05 relative to vehicle-treated BMSCs.

Figure 2. BPA reduces the self-renewal capacity of BMSCs. BMSCs treated with 100 nM or 1 μM BPA for 1 d or 5 d were plated at low density, incubated for 14 d, and fixed and stained with crystal violet. (A) Colonies greater than 2 mm2 in diameter were counted. (B) Colonies stained with crystal violet were destained, and absorbance was measured on a plate reader at 584 nm. Values represent the ratio of absorbance to the number of CFU. Values represent triplicates and 3 independent experiments for each of the 3 donors. Bar ± SD. **, P < 0.01; ***, P < 0.001 relative to vehicle-treated BMSCs.
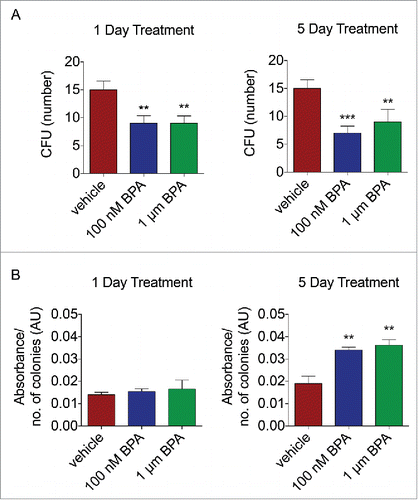
Figure 2. BPA reduces the self-renewal capacity of BMSCs. BMSCs treated with 100 nM or 1 μM BPA for 1 d or 5 d were plated at low density, incubated for 14 d, and fixed and stained with crystal violet. (A) Colonies greater than 2 mm2 in diameter were counted. (B) Colonies stained with crystal violet were destained, and absorbance was measured on a plate reader at 584 nm. Values represent the ratio of absorbance to the number of CFU. Values represent triplicates and 3 independent experiments for each of the 3 donors. Bar ± SD. **, P < 0.01; ***, P < 0.001 relative to vehicle-treated BMSCs.

Figure 3. BPA enhances the adipogenic differentiation of BMSCs. BMSCs treated with 1 μM BPA for 5 d. (A) Treated cells were incubated in osteogenic or adipogenic differentiation medium and stained with Alizarin Red or Oil Red O, respectively, after 14 d. Representative images showing osteogenic and adipogenic differentiation are shown. Bars represent 200 μm. (B) Stains were eluted and absorbance values were obtained on a plate reader at 584 nm. Samples were normalized to the amount of protein present. (C) Cells were assessed by qRT-PCR analysis of total cellular RNA prepared from vehicle- or DDT-treated cells. Values are normalized to β-actin. Values represent triplicates and 3 independent experiments for each of the 3 donors. Bar ± SD. *, P < 0.05; **, P < 0.01; ***, P < 0.001 relative to vehicle-treated BMSCs.
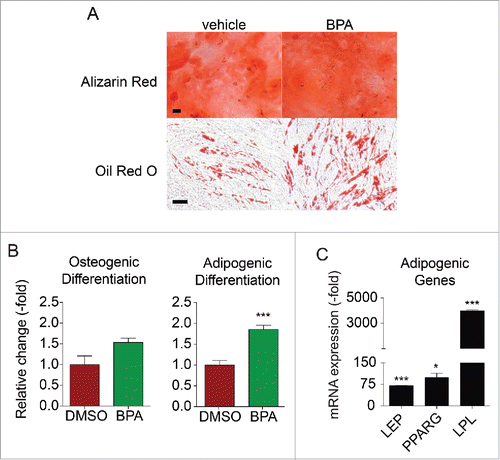
Figure 3. BPA enhances the adipogenic differentiation of BMSCs. BMSCs treated with 1 μM BPA for 5 d. (A) Treated cells were incubated in osteogenic or adipogenic differentiation medium and stained with Alizarin Red or Oil Red O, respectively, after 14 d. Representative images showing osteogenic and adipogenic differentiation are shown. Bars represent 200 μm. (B) Stains were eluted and absorbance values were obtained on a plate reader at 584 nm. Samples were normalized to the amount of protein present. (C) Cells were assessed by qRT-PCR analysis of total cellular RNA prepared from vehicle- or DDT-treated cells. Values are normalized to β-actin. Values represent triplicates and 3 independent experiments for each of the 3 donors. Bar ± SD. *, P < 0.05; **, P < 0.01; ***, P < 0.001 relative to vehicle-treated BMSCs.

Table 1. RNA-sequencing analysis of BMSCs exposed to BPA.

Figure 4. ER inhibitor reverses the effects of BPA on BMSC proliferation and self-renewal. BMSCs were simultaneously treated with BPA and fulvestrant (ICI182,780; 100 nM) or MEK1/2 inhibitor PD184,352 (1 μM) for 5 d. (A) Treated cells were seeded in a 96-well plate and analyzed on day 7 with the MTT assay. (B) Treated BMSCs were plated at low density, incubated for 14 d, and fixed and stained with crystal violet. Colonies greater than 2 mm2 in diameter were counted. Values represent triplicates and 3 independent experiments for each of the 3 donors. Bar ± SD. *, P < 0.05 relative to vehicle-treated BMSCs.
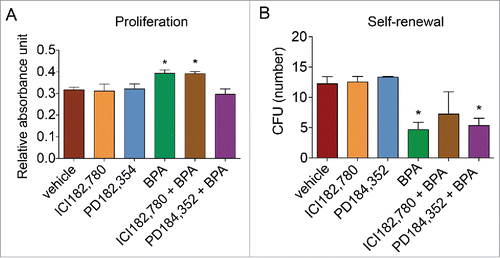
Figure 4. ER inhibitor reverses the effects of BPA on BMSC proliferation and self-renewal. BMSCs were simultaneously treated with BPA and fulvestrant (ICI182,780; 100 nM) or MEK1/2 inhibitor PD184,352 (1 μM) for 5 d. (A) Treated cells were seeded in a 96-well plate and analyzed on day 7 with the MTT assay. (B) Treated BMSCs were plated at low density, incubated for 14 d, and fixed and stained with crystal violet. Colonies greater than 2 mm2 in diameter were counted. Values represent triplicates and 3 independent experiments for each of the 3 donors. Bar ± SD. *, P < 0.05 relative to vehicle-treated BMSCs.

Figure 5. ER and MEK1/2 inhibitor reduces the adipogenic inductive effects of BPA in BMSCs. BMSCs treated with BPA alone or simultaneously with ER inhibitor (ICI182,780; 100 nM) or MEK1/2 inhibitor (PD184,352; 1 μM) for 5 d were incubated in osteogenic or adipogenic differentiation medium and stained with Alizarin Red or Oil Red O, respectively, after 14 d. Stains were eluted and absorbance values were obtained on a plate reader at 584 nm. Samples were normalized to the amount of protein present. Bar ± SD. ***, P < 0.001 relative to vehicle-treated BMSCs.
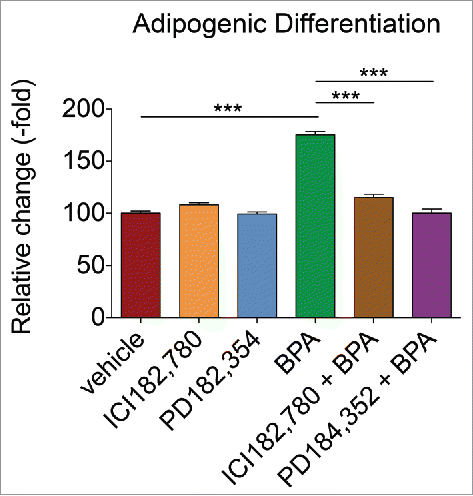
Figure 5. ER and MEK1/2 inhibitor reduces the adipogenic inductive effects of BPA in BMSCs. BMSCs treated with BPA alone or simultaneously with ER inhibitor (ICI182,780; 100 nM) or MEK1/2 inhibitor (PD184,352; 1 μM) for 5 d were incubated in osteogenic or adipogenic differentiation medium and stained with Alizarin Red or Oil Red O, respectively, after 14 d. Stains were eluted and absorbance values were obtained on a plate reader at 584 nm. Samples were normalized to the amount of protein present. Bar ± SD. ***, P < 0.001 relative to vehicle-treated BMSCs.
Supplemental material

KEND_1200344_Supplemental_Table_1_and_Figure_1.pdf

Download PDF (238.1 KB)