1,394
Views
4
CrossRef citations to date
0
Altmetric
Original Research Paper

R-equol, a synthetic metabolite of the dietary estrogen daidzein, modulates the nongenomic estrogenic effects of 17β-estradiol in pituitary tumor cells

, & , PhD, Professor
Article: e1226697 | Received 17 May 2016, Accepted 16 Aug 2016, Published online: 18 Oct 2016

Figures & data

Figure 1. Structure of E2, daizein and R-eq. Upper Row: Two-dimensional (2D) structure comparisons of 17β estradiol, daidzein, and R-eq. Note hydroxyl groups at opposite ends of the molecules that are thought to be essential for binding into the ligand-binding pocket on ERα.Citation8 Lower Row: Three-dimensional (3D) structures showing differences in the spatial arrangements of these hydroxyl groups (red-white) in the same compounds. The asymmetric center of R-eq is shown at the rightmost position (red dotted circle)Citation9,10.
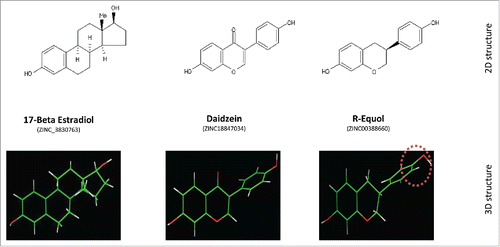
Figure 1. Structure of E2, daizein and R-eq. Upper Row: Two-dimensional (2D) structure comparisons of 17β estradiol, daidzein, and R-eq. Note hydroxyl groups at opposite ends of the molecules that are thought to be essential for binding into the ligand-binding pocket on ERα.Citation8 Lower Row: Three-dimensional (3D) structures showing differences in the spatial arrangements of these hydroxyl groups (red-white) in the same compounds. The asymmetric center of R-eq is shown at the rightmost position (red dotted circle)Citation9,10.

Figure 2. Time-dependent effects of E2 and R-eq on MAPK activations. Cells were exposed to physiologic levels of E2 (1nM), and dietary levels of R-eq (15nM) for 2.5 - 60 min. (A) Effects of E2 and R-eq on ERK phosphorylation (pERK). For E2 n = 56 spread over 6 experiments; for R-eq n=56 over 4 experiments. (B) Effects of E2 and R-eq on JNK phospho-activation (pJNK). For E2 or R-eq, n = 38 over 3 experiments. (C) Effects of E2 and R-eq on p38 phospho-activation (p-p38). For E2 n = 38 over 4 experiments; for R-eq n = 46 over 4 experiments. * = significant at p< 0.05 vs. control (vehicle) group.
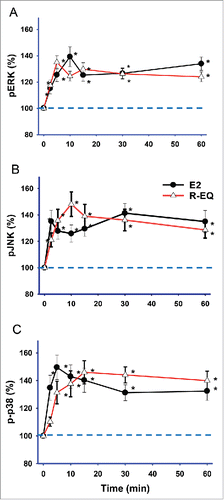
Figure 2. Time-dependent effects of E2 and R-eq on MAPK activations. Cells were exposed to physiologic levels of E2 (1nM), and dietary levels of R-eq (15nM) for 2.5 - 60 min. (A) Effects of E2 and R-eq on ERK phosphorylation (pERK). For E2 n = 56 spread over 6 experiments; for R-eq n=56 over 4 experiments. (B) Effects of E2 and R-eq on JNK phospho-activation (pJNK). For E2 or R-eq, n = 38 over 3 experiments. (C) Effects of E2 and R-eq on p38 phospho-activation (p-p38). For E2 n = 38 over 4 experiments; for R-eq n = 46 over 4 experiments. * = significant at p< 0.05 vs. control (vehicle) group.

Figure 3. Dose-dependent effects of E2 and R-eq on MAPK activations. Cells were exposed for 5 min to various concentrations of E2 and R-eq. A), B) and C) line graphs demonstrating the effects of E2 and R-eq on pERK, pJNK and p-p38, respectively. * = p< 0.05 vs. control (vehicle) group.
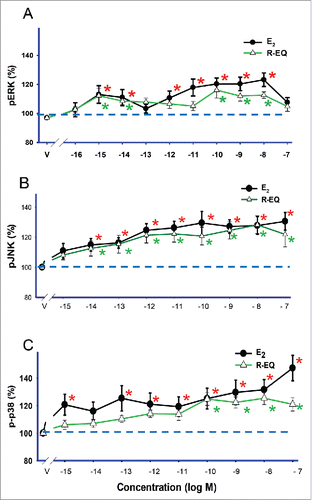
Figure 3. Dose-dependent effects of E2 and R-eq on MAPK activations. Cells were exposed for 5 min to various concentrations of E2 and R-eq. A), B) and C) line graphs demonstrating the effects of E2 and R-eq on pERK, pJNK and p-p38, respectively. * = p< 0.05 vs. control (vehicle) group.

Figure 4. Dose-dependent effects of added R-eq on E2-induced MAPK activities. Cells were exposed for 5 min to a mixture of E2 (1nM, physiological concentration) and R-eq (range 10−16 to 10−7M). pERK (A), pJNK (B) and p-p38 (C) were measured compared to the activity level of the vehicle-treated controls (*= p< 0.05 vs. control) and the 1nM E2-induced (see horizontal stippled bars) pERK, pJNK and p-p38 levels (# = p < 0.05 vs E2).
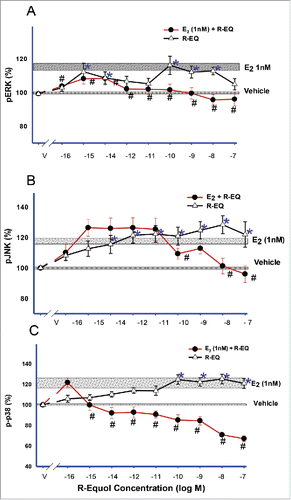
Figure 4. Dose-dependent effects of added R-eq on E2-induced MAPK activities. Cells were exposed for 5 min to a mixture of E2 (1nM, physiological concentration) and R-eq (range 10−16 to 10−7M). pERK (A), pJNK (B) and p-p38 (C) were measured compared to the activity level of the vehicle-treated controls (*= p< 0.05 vs. control) and the 1nM E2-induced (see horizontal stippled bars) pERK, pJNK and p-p38 levels (# = p < 0.05 vs E2).

Figure 5. E2 and R-eq, alone or in combination – effects on GTP-bound Gαi. Cells were exposed to E2 (1nM) or R-eq (15nM) or both for 5 min, using the irreversible binding of the GTPγS analog to measure cumulative binding. GTPγS-bound Gαi levels were detected using an Ab specific for the complex. Vehicle n = 36; E2 n = 20, and R-Eq n = 36, over 2 experiments. * = significance at p < 0.05 vs. vehicle; # = significance vs. E2; $ = significance vs. R-eq.
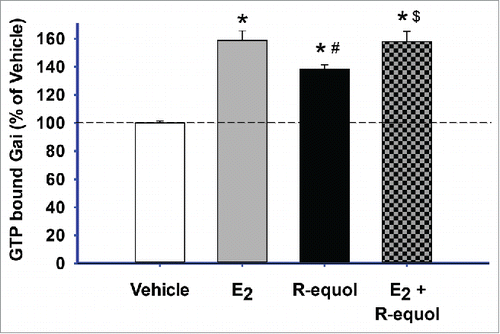
Figure 5. E2 and R-eq, alone or in combination – effects on GTP-bound Gαi. Cells were exposed to E2 (1nM) or R-eq (15nM) or both for 5 min, using the irreversible binding of the GTPγS analog to measure cumulative binding. GTPγS-bound Gαi levels were detected using an Ab specific for the complex. Vehicle n = 36; E2 n = 20, and R-Eq n = 36, over 2 experiments. * = significance at p < 0.05 vs. vehicle; # = significance vs. E2; $ = significance vs. R-eq.

Figure 6. Effects of E2, R-Eq, and their combination on intracellular calcium concentrations and PRL release. Cells were exposed to E2 (1nM) or R-eq (15nM) or both for 1 min. (A) Effects of E2 and R-eq on intracellular calcium levels compared to vehicle control. Vehicle n = 142; E2 n = 72; R-eq n = 25, over 4 experiments. (B) Effects of E2 and R-eq on PRL release. The concentration of PRL released into the medium was measured by radioimmunoassay. Vehicle n = 36; E2 n = 30 and R-eq n = 30, over 3 experiments. *=significance vs. vehicle, #=significance vs. E2 at p<0.05.
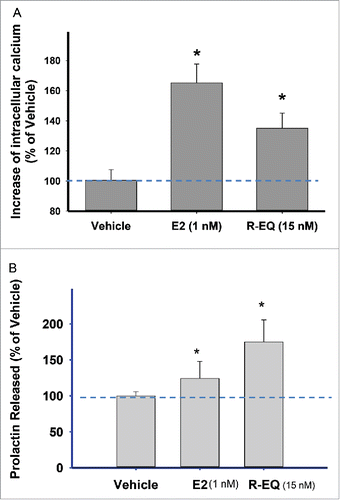
Figure 6. Effects of E2, R-Eq, and their combination on intracellular calcium concentrations and PRL release. Cells were exposed to E2 (1nM) or R-eq (15nM) or both for 1 min. (A) Effects of E2 and R-eq on intracellular calcium levels compared to vehicle control. Vehicle n = 142; E2 n = 72; R-eq n = 25, over 4 experiments. (B) Effects of E2 and R-eq on PRL release. The concentration of PRL released into the medium was measured by radioimmunoassay. Vehicle n = 36; E2 n = 30 and R-eq n = 30, over 3 experiments. *=significance vs. vehicle, #=significance vs. E2 at p<0.05.

Figure 7. Dose-dependent effects of E2, R-eq, and their combination on cell proliferation. Cells were exposed to various doses of E2, R-eq and a mixture of E2 and R-eq for 3 d. (A) E2 vs. R-eq at a range of doses for each (10−16 to 10−6 M). For E2 n = 42 over 7 experiments; for R-eq n = 30 over 5 experiments. All E2 treated cells were significantly different than vehicle controls or R-eq at p< 0.05 (*). (B) A mixture of various concentration of R-eq (10−16 to 10−7 M) with a physiological E2 concentration (1nM). For E2 + R-eq n = 24 in 3 experiments; for R-eq n = 30 over 5 experiments. * = p < 0.05 vs. control (vehicle) group. # = p < 0.05 vs E2.
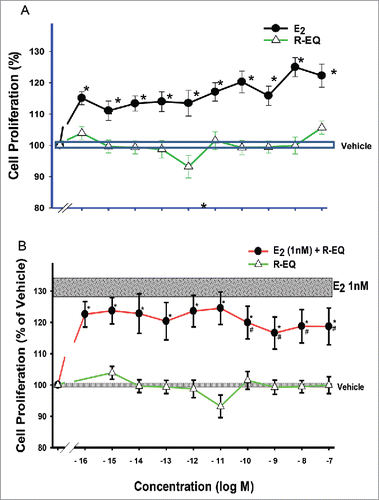
Figure 7. Dose-dependent effects of E2, R-eq, and their combination on cell proliferation. Cells were exposed to various doses of E2, R-eq and a mixture of E2 and R-eq for 3 d. (A) E2 vs. R-eq at a range of doses for each (10−16 to 10−6 M). For E2 n = 42 over 7 experiments; for R-eq n = 30 over 5 experiments. All E2 treated cells were significantly different than vehicle controls or R-eq at p< 0.05 (*). (B) A mixture of various concentration of R-eq (10−16 to 10−7 M) with a physiological E2 concentration (1nM). For E2 + R-eq n = 24 in 3 experiments; for R-eq n = 30 over 5 experiments. * = p < 0.05 vs. control (vehicle) group. # = p < 0.05 vs E2.