
Figures & data
Figure 1. Average annual rainfall and temperatures (1991–2020) for Kenya.
Source: Authors' computation of temperature and rainfall data from World Bank Climate Change Knowledge Portal (Citation2021).
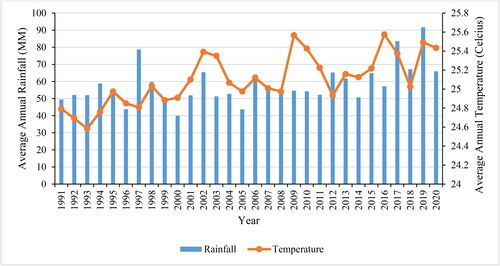
Figure 2. Number of undernourished people (2000–2019) in Kenya.
Source: Authors' computation of FAOSTAT data (Citation2018).
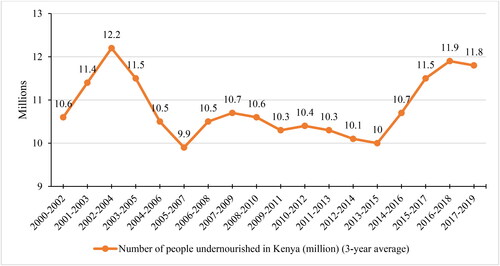
Figure 3. Land use and trend in crop yields (2012–2017) in Kenya.
Source: Authors' computation of FAOSTAT data (Citation2018).
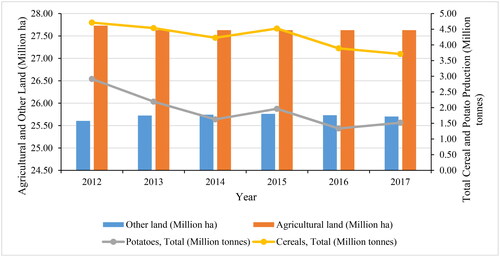
Figure 4. Average projected monthly precipitation and temperature (2020–2039) for Kenya.
Source: Authors' computation of temperature and rainfall data from World Bank Climate Change Knowledge Portal (Citation2021).
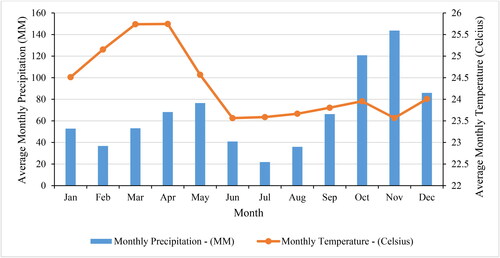
Figure 5. Stages in the technology adoption process.
Source: Rogers (Citation2003).
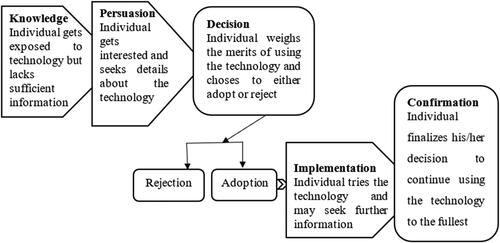
Figure 6. Map showing the location of the study area.
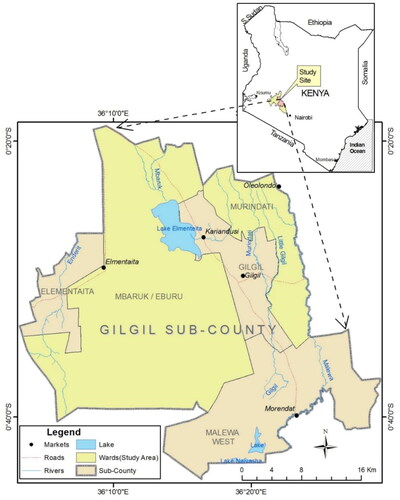
Table 1. Proportion of sample size per ward.
Table 2. Descriptive statistics for institutional factors among smallholder potato farmers.
Table 3. Access to credit and adoption of climate-smart agriculture.
Table 4. Training on and adoption of climate-smart agriculture.
Table 5. Non-government organization support and adoption of climate-smart agriculture.
Table 6. Farmer group membership and adoption of climate-smart agriculture.
Figure 7. Extent of CSA adoption.
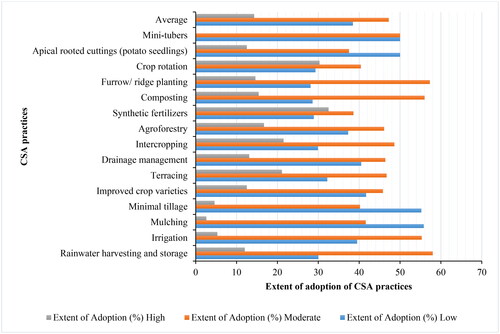
Table 7. Omnibus tests of model coefficients for institutional factors.
Table 8. Institutional factors' model summary.
Table 9. Percentage accuracy classification tableTable Footnotea for institutional factors' model.
Table 10. Hosmer and lemeshow test for institutional factors' BLRM.
Table 11. Institutional variables in the binary logistic regression equation.
Data availability statement
The data that support the findings of this study are available from the corresponding author, AW, upon reasonable request.