
Figures & data
Table 1. Variables in the double hurdle model.
Table 2. Socio-demographic characteristics of respondents (1).
Table 3. Socio-demographic characteristics of respondents (2).
Table 4. Gini coefficient analysis for wholesalers.
Table 5. Willingness to accept locally produced chicken.
Table 6. Percentage of poultry capacity distributors are willing to start with.
Table 7. Factors that determine willingness to accept and extent of acceptance.
Table 8. Factors that determine willingness to accept and extent of acceptance (Heckman model).
Table 9. Perceived opportunities and constraints of accepting locally produced chicken by actors in the frozen chicken supply chain.
Figure A1. Lorenz curve for importers.
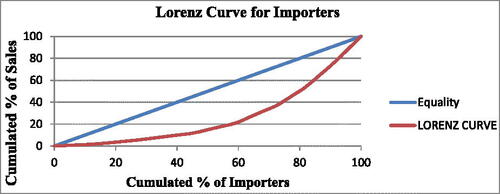
Figure B1. Lorenz curve for wholesalers.
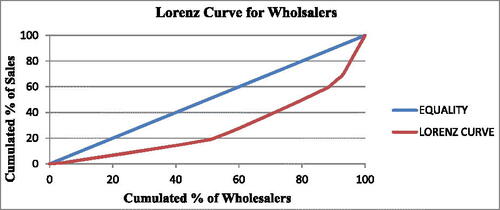
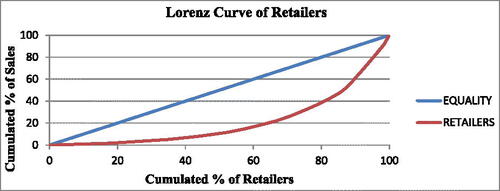
Figure C1. Lorenz curve for retailers.
Data availability statement
We, the authors of this manuscript, would like to confirm that all raw data will be available with a reasonable request.