
Figures & data
Figure 1. Research hypothesis.
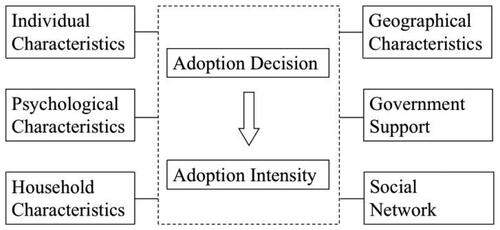
Figure 2. Map showing the geographical location of studied counties and the respective areas covered in the data collection.
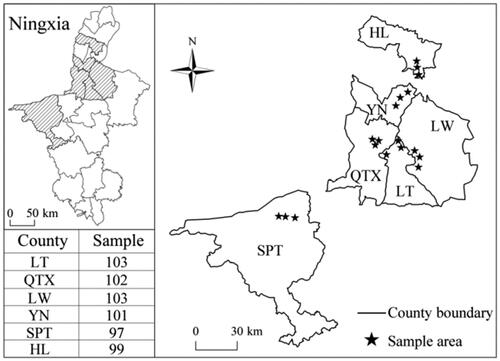
Table 1. Definitions and excepted effect of explanatory variables included in the model.
Table 2. Summary statistics of explanatory variables included in the model.
Figure 3. Distribution of adoption.
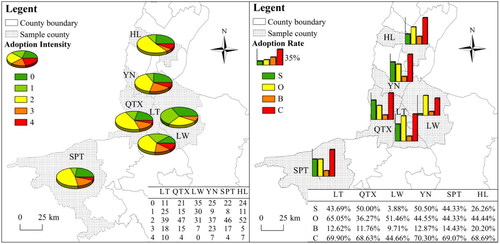
Table 3. Estimated results of Heckman two-stage model.