
Figures & data
Table 1. HVI values of cotton bundle fiber properties.
Table 2. Descriptive statistics.
Table 3. ANOVA table.
Table 4. BT JKCH-1947 and Organic (MRC 270).
Table 5. Cotton varieties grading (TIDI).
Figure 1. Spinning consistency index mean graph.
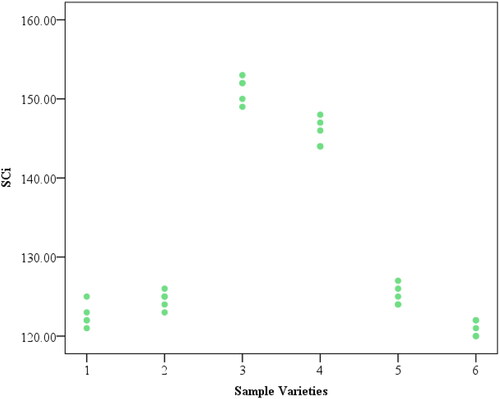
Figure 2. Micronaire mean graph.
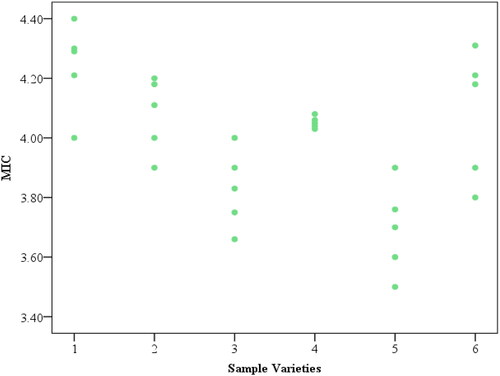
Figure 3. Maturity mean graph.
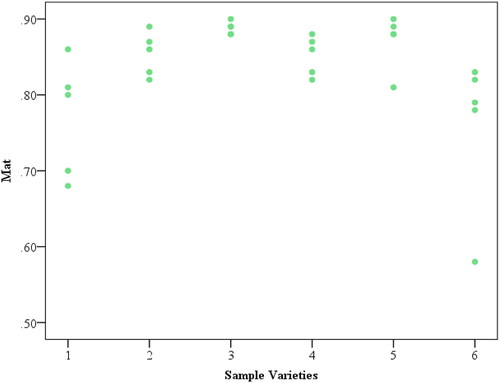
Figure 4. Uniformity index mean graph.
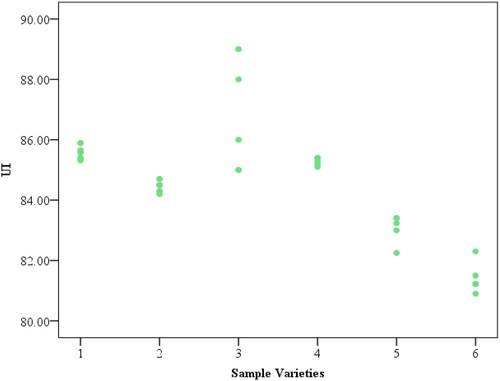
Figure 5. Fiber elongation mean graph.
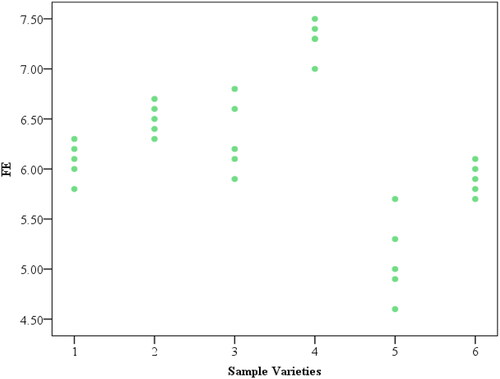
Figure 6. Reflectance mean graph.
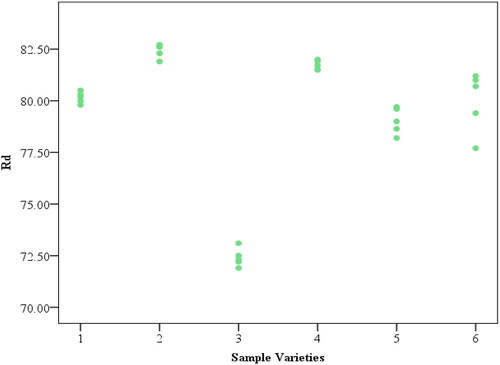
Figure 7. Yellowness mean graph.
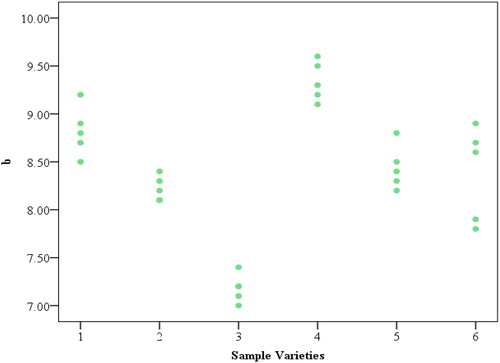
Figure 8. Short fiber index mean graph.
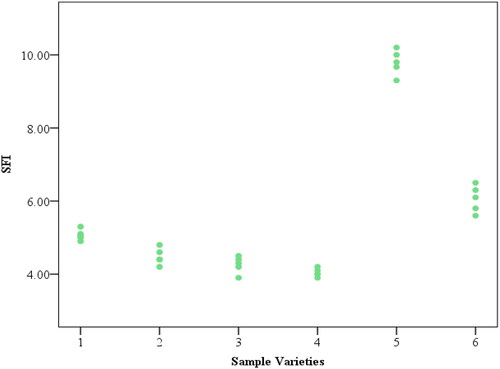
Figure 9. Upper half mean length mean graph.
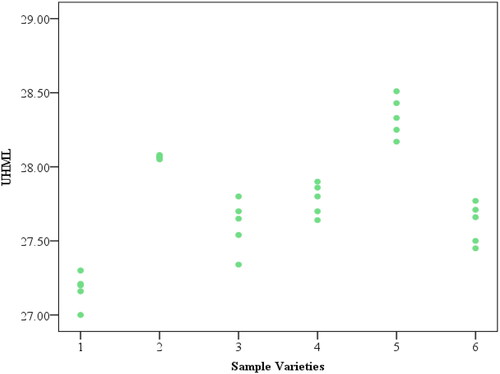
Figure 10. Fiber strength mean graph.
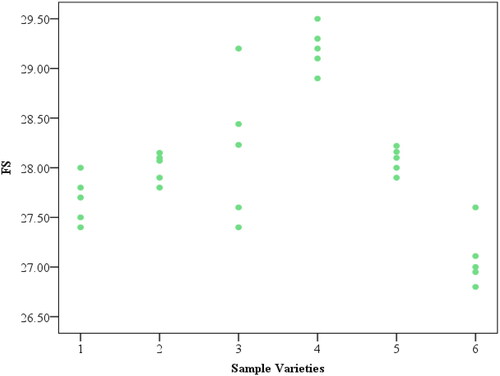
Table 6. Correlation between cotton fiber parameters.
About the Author.docx
Download MS Word (13.4 KB)Supplmentary material.docx
Download MS Word (31 KB)Data availability statement
The authors have annotated the entire data-building process, the empirical techniques presented in the paper, and the number of runs generated using SPSS 22 software for the characterization and analysis of the cotton parameters of different varieties. All data used to support the findings of this study are included in the paper.