
Figures & data
Figure 1. Stringency index and cumulative number of Covid-19 cases in Uganda from January 2020 to July 2022.
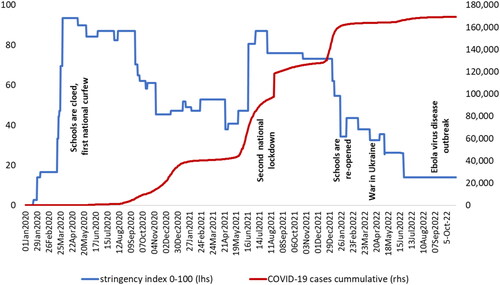
Figure 2. Map of showing the different divisions in Kampala.
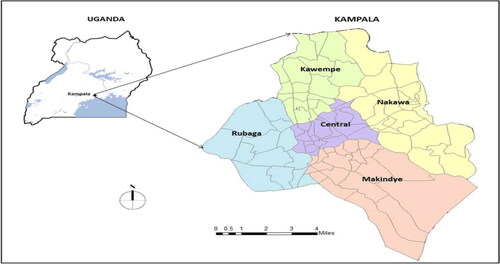
Table 1. Description of variables.
Table 2. Characteristics of butcher traders by type of meat.
Table 3. T-test for effect of Covid 19.
Table 4. T test for post Covid behavior.
Figure 3. Impact of Covid 19 on daily beef and goat supply.
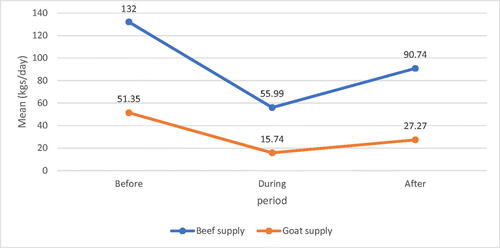
Figure 4. Effect of Covid 19 on weekly meat sales.
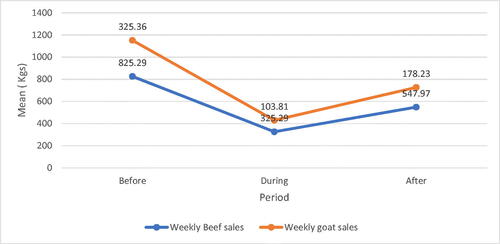
Figure 5. Covid effect on buying and selling price.
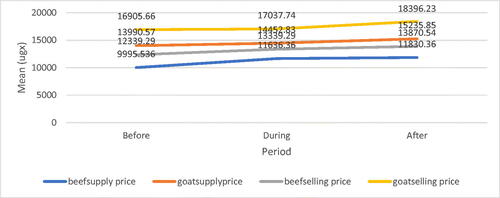
Figure 6. Effect on the number of customers served every week.
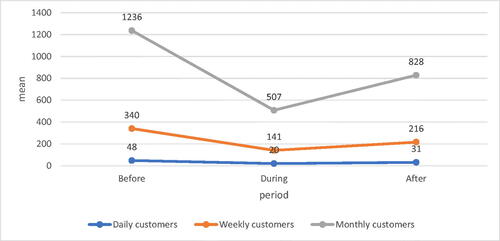
Table 5. Tobit results for meat supply and sales effect.
Table 6. Linear regression and Tobit results for meat supply recovery.
Figure 7. Cope up with decrease in meat supply.
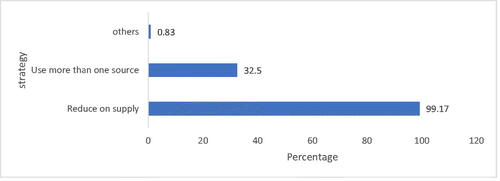
Figure 8. Cope up with increase in supply price.
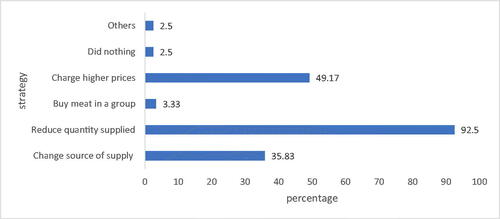
Figure 9. Cope up with decrease in volume of sales.
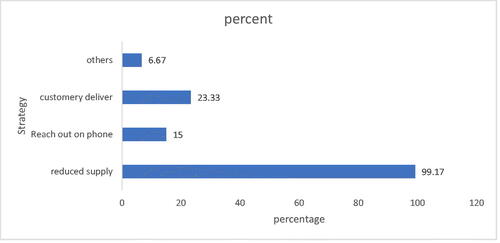
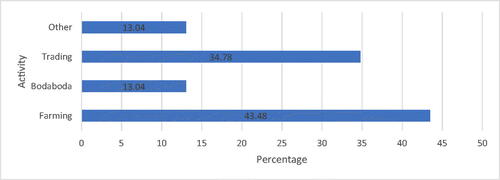
Figure 10. Other activities.
Data availability statement
Data for this manuscript is availability and it can be provided when requested for.