Figures & data
Table 1. Description of the test genotypes.
Table 2. Analysis of variance (mean squares) for 20 studied traits of 49 durum wheat accessions studied at Sinana and Selka during 2018/19.
Table 3. Analysis of variance (mean squares) for 20 studied traits of 49 durum wheat accessions studied over locations during 2018/19.
Table 4. Estimate of range, mean, phenotypic (σ2p), genotypic (σ2g) and environmental (σ2e) variances, phenotypic (PCV) and genotypic (GCV) coefficient of variability, broad sense heritability (H2%), genotypic × location variance (σ2gl), expected genetic advance (GA) and genetic advance as percent of the mean (GA %) for twenty characters for combined over locations, 2018/19.
Figure 1. Residual viscoelastic mass water insoluble protein fractions (gluten).
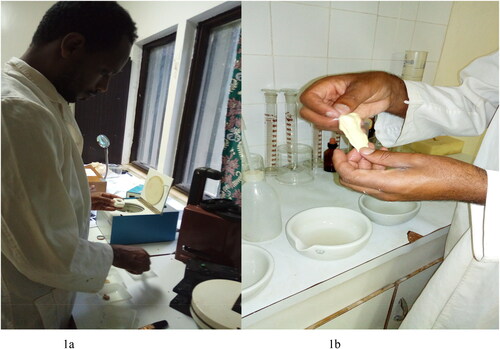
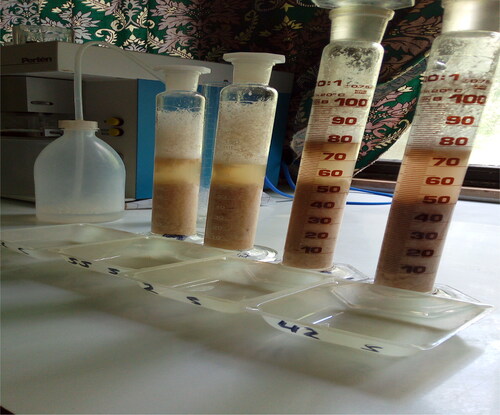
Figure 2. Sodium dodecyl sulphate (SDS) sedimentation.