
Figures & data
Figure 1. The Exploratory sequential mixed method design guiding the study.
Source: Adapted from Creswell (2012).
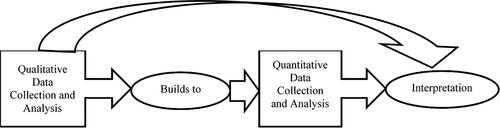
Table 1. Dependent variables measuring farmers’ food insecurity coping strategies.
Table 2. Descriptive statistics.
Table 3. Farmers’ pairwise matrix ranking of their coping strategies for food insecurity.
Table 4. Incidence rate ratios from Poisson regressions showing the influence of ARP on farmers’ coping strategies for food insecurity.
Table 5. Results of the Seemingly Unrelated Regression (SUR) models.
Supplemental material