
Figures & data
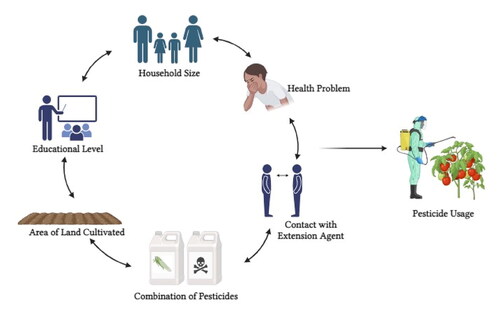
Figure 1. Map of Pru West District showing the study locations (Zabrama, Abease, Bupe, and Dama Nkwanta) in the Bono East Region of Ghana.
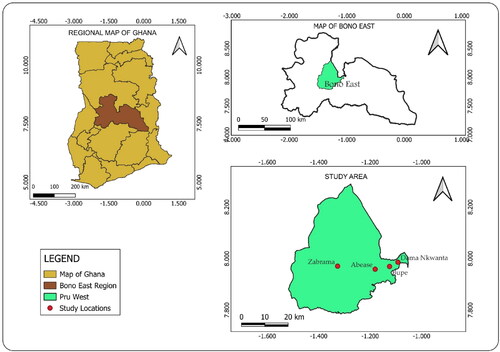
Table 1. Description of variables used for the analysis.
Table 2. Socio-demographic characteristics of farmers (n = 120).
Figure 2. Varieties of tomatoes cultivated by tomato farmers in the Pru West District of Ghana.
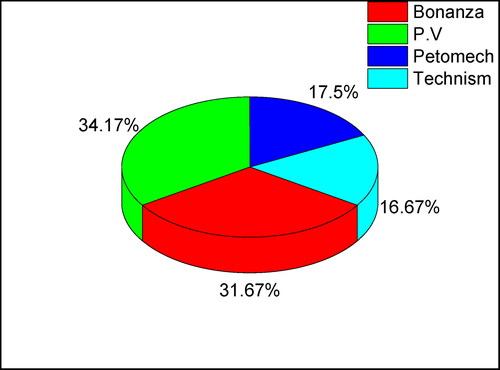
Table 3. Farmers’ farm characteristics.
Table 4. Farmers adherence to pesticide usage instructions during pesticide application.
Figure 3. Farmers’ (a) source of information on the application and usage of agrochemicals and (b) source of agrochemicals (the results represent multiple choice of the source of agrochemicals).
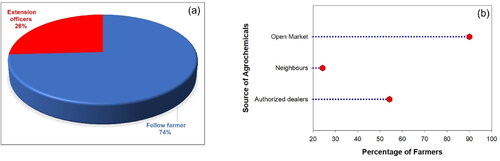
Figure 4. Use of personal protective equipment (PPE) among tomato farmers’.
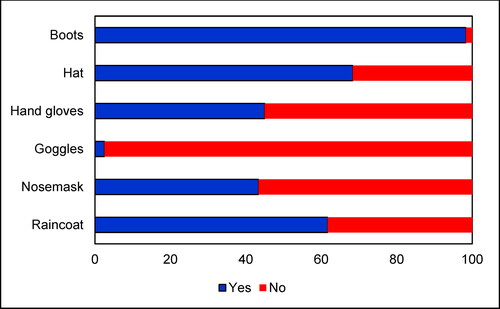
Table 5. Farmer’s knowledge of pesticide usage.
Figure 5. Farmers’ knowledge of the misuse/inappropriate usage of pesticides in the control of pests on their farms. Red colour represents affirmation (yes), and blue colour represents no.
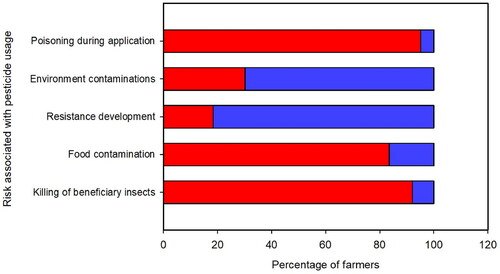
Table 6. Factors influencing the usage of pesticides in tomato farms.
Data availability statement
Data will be made available upon reasonable request from the corresponding author.