
Figures & data
Figure 1. Study area map. Satelite picture source: https://earthexplorer.usgs.gov.
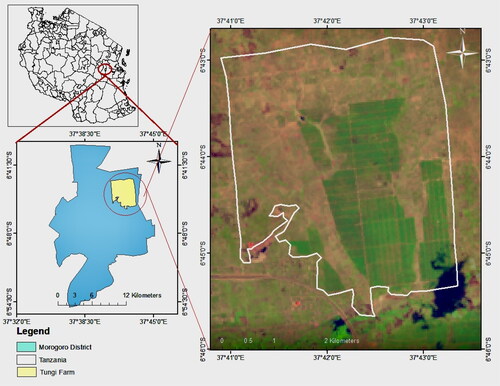
Figure 2. Digital elevation model map.
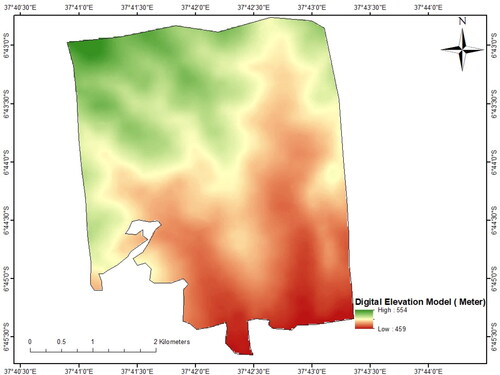
Figure 3. Slope map.
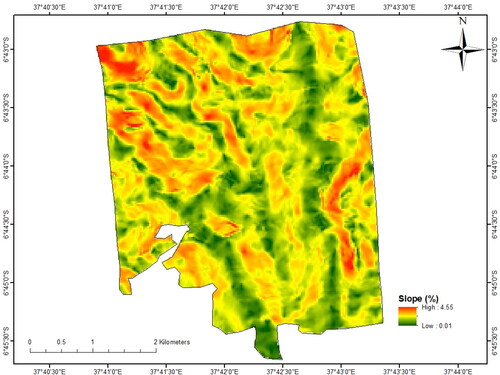
Figure 4. Soil sampling points in the six sampling units.
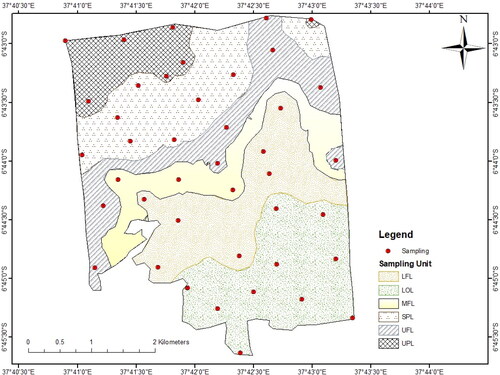
Table 1. The Saaty’s rating scale.
Table 2. Random consistency index (RCI).
Table 3. Land requirement for Sunflower production.
Table 4. Sub-rating of the physical and chemical characteristics of the soils.
Figure 5. Methodology workflow for the production of suitability map.
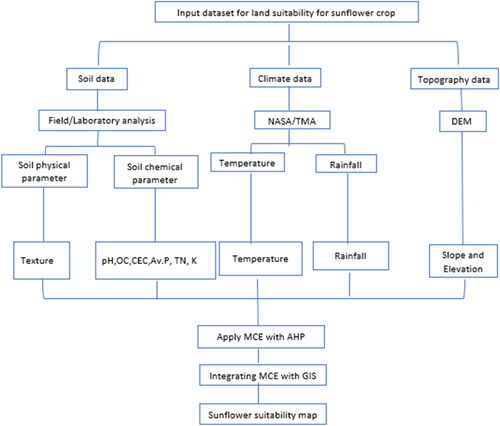
Figure 6. pH Suitability map for sunflower production of Tungi Farm.
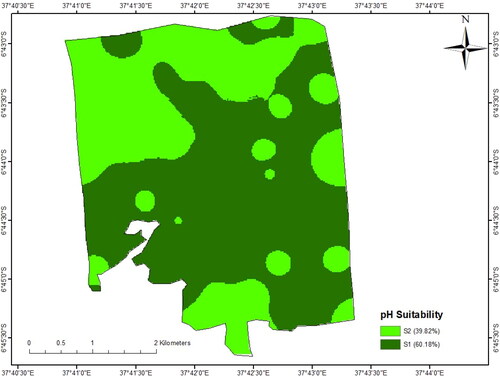
Table 5. Suitability classes.
Table 6. Pairwise comparison matrix for sunflower production.
Table 7. Main Criteria ranking for sunflower production.
Table 8. Summary of parameter, suitability level, and area coverage for sunflower production.
Figure 7. Organic Carbon (OC) suitability map for sunflower production of Tungi Farm.
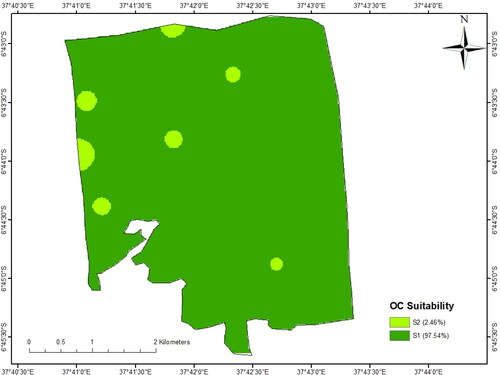
Figure 8. Total Nitrogen (TN) suitability map for sunflower production of Tungi Farm.
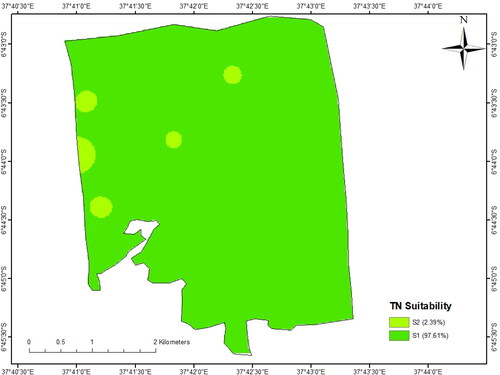
Figure 9. Available phosphorus suitability map for sunflower production of Tungi Farm.
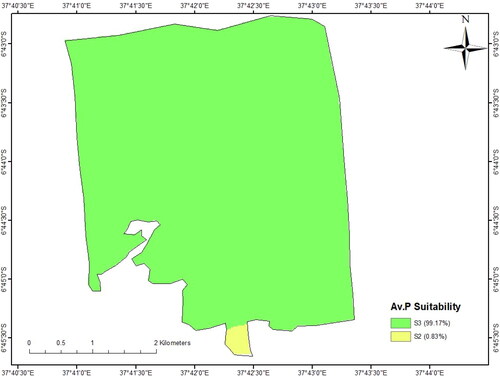
Figure 10. Potassium suitability map for sunflower production of Tungi Farm.
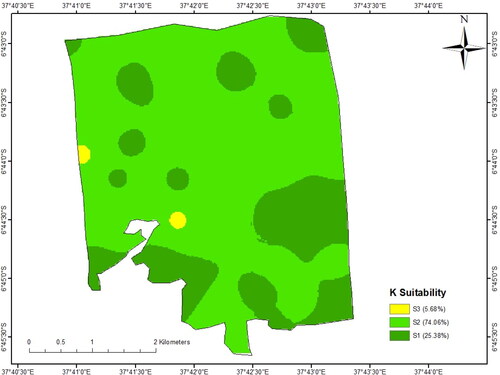
Figure 11. CEC suitability map for sunflower production of Tungi Farm.
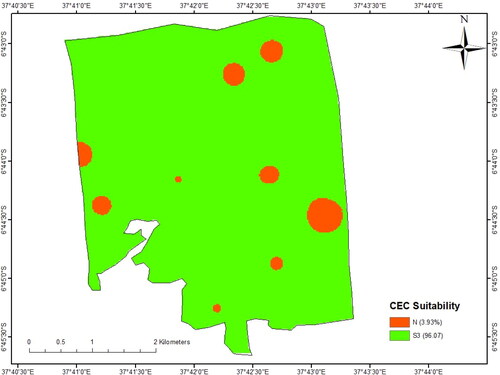
Figure 12. Texture suitability map for sunflower production of Tungi Farm.
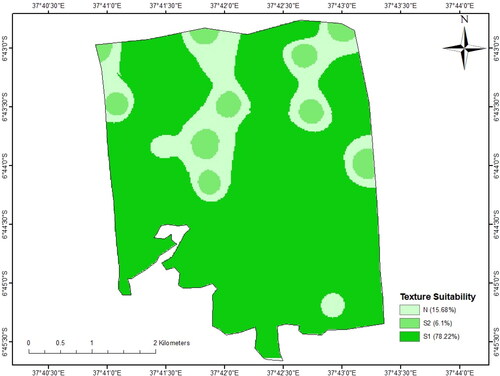
Figure 13. Elevation suitability map for sunflower production of Tungi Farm.
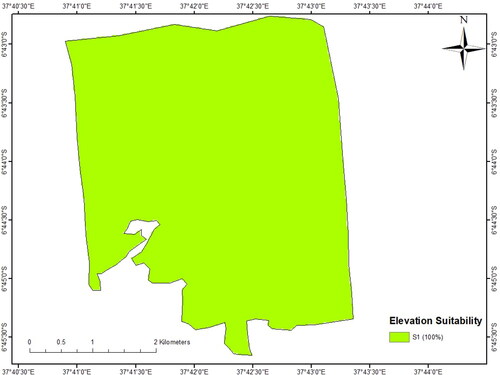
Figure 14. Slope suitability map for sunflower production of Tungi Farm.
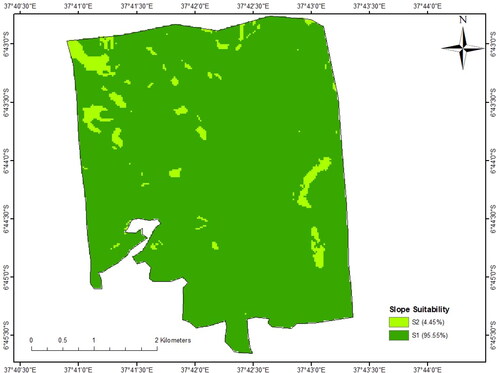
Figure 15. Rainfall suitability map for sunflower production of Tungi Farm.
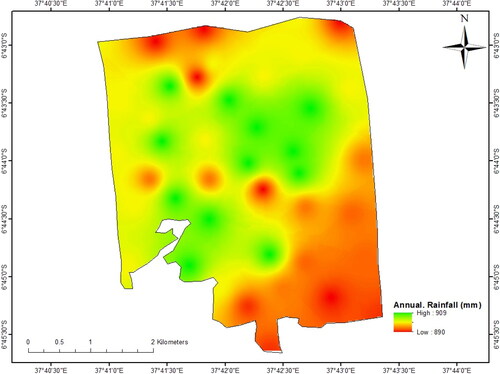
Figure 16. Temperature suitability map for sunflower production of Tungi Farm.
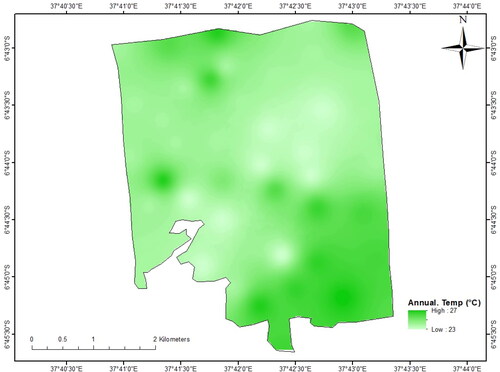
Figure 17. Sunflower suitability map for Tungi Farm.
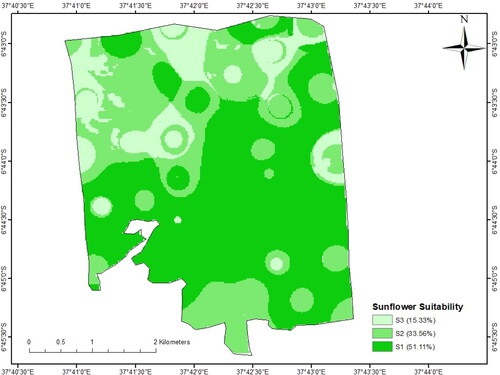
Table 9. Suitability and area coverage of Tungi Farm for sunflower production.