
Figures & data
Figure 1. Trend in coffee production in DRC.
Source: FAOSTAT data (2023).
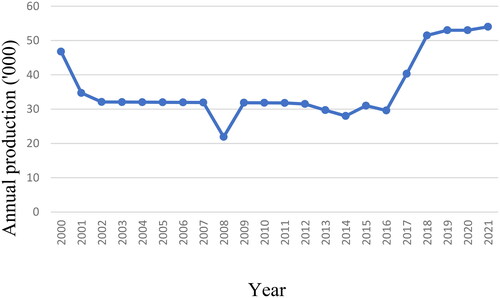
Table 1. Description of exogenous variables in Equation (9) and their expected signs.
Figure 2. A map of DRC showing the location of Kalehe Territory in South Kivu Province.
Source: Author.
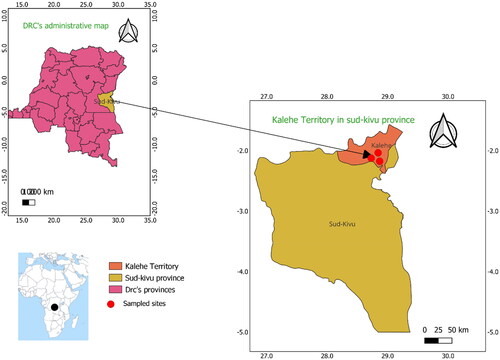
Table 2. Summary statistics of socio-demographic characteristics of CSAT adopters and non-adopters in Kalehe Territory, DRC.
Table 3. Factors influencing CSAT adoption among smallholder coffee farmers in Kalehe Territory, DRC.
Table 4. Potential substitutability between the three CSATs used in coffee production in Kalehe Territory, DRC.
Data availability statement
Data will be made available on request.