
Figures & data
Figure 1. A schematic diagram representing randomization and assigning 13 treatments in RCBD design with three replications under field conditions.
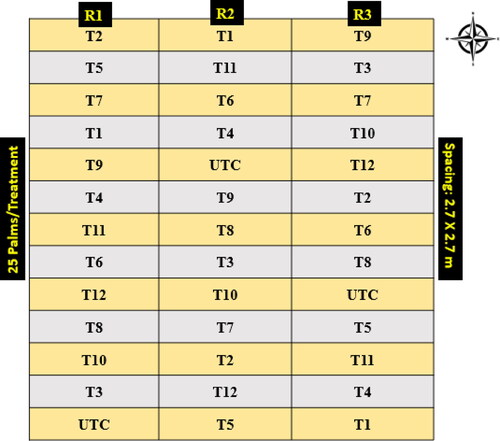
Table 1. Oomycete-specific fungicidal products for the control of fruit rot disease (FRD) of arecanut during 2018 and 2019 in the Malnad region, Karnataka, India.
Table 2. The following rating scale was utilized to estimate the percent disease severity of FRD on arecanut.
Figure 2. Fruit rot disease (FRD) severity (green colored) and reduction in severity or control efficiency (%, yellow colored) of different contact and systemic oomycete-specific fungicides in 2018 and 2019. The error bars indicate the standard error of the mean.
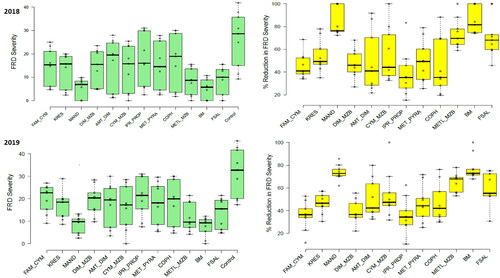
Figure 3. Fruit rot disease (FRD) incidence (green colored) and the corresponding reduction in incidence or control efficiency (%, yellow colored) of different contact and systemic oomycete-specific fungicides in 2018 and 2019. The error bars indicate the standard error of the mean.
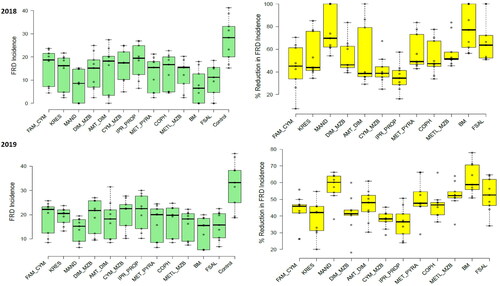
Figure 4. CFNR (green colored) and the corresponding reduction in incidence or control efficiency (%, yellow colored) of different oomycete-specific fungicides in 2018 and 2019. The error bars indicate the standard error of the mean.
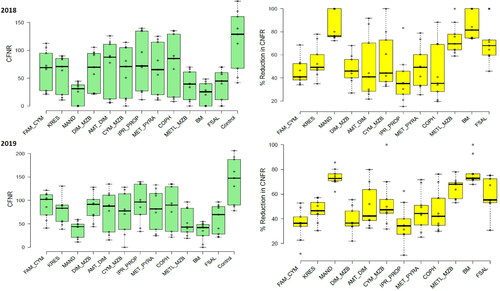
Table 3. FRD severity, control efficiency and other corresponding statistics of 12 fungicides evaluated at pre-monsoon time for control of FRD in 2018 and 2019.
Table 4. FRD severity, control efficiency and associated parameters for 12 fungicides tested during the Mid-monsoon period for control of FRD in 2018 and 2019.
Table 5. FRD severity, control efficiency and associated parameters for 12 fungicides were evaluated during fag-end monsoon for control of FRD in 2018 and 2019.
Table 6. Variations in FRD severity and control efficiency between the time of fungicidal application for control of FRD in 2018 and 2019.
Data availability statement
The data that support the findings of this study are available from the corresponding author, [Balanagouda Patil], upon reasonable request.