Figures & data
Figure 1. Location of the study Site. Source: Climate Change Agriculture and Food Security (CCAFS), site of Nyando/KatukuOdeyo, Kenya, in Sijmons et al. (Citation2013).
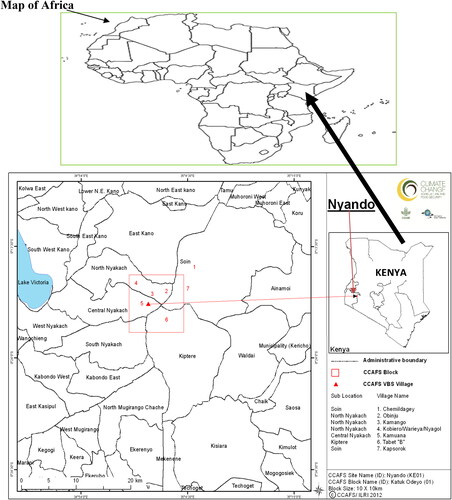
Table 1. Descriptive statistics of variables used in the Logit regression model.
Figure 2. Shocks experienced (%) by Respondents. Source: Baseline Survey data, (2018–2019).
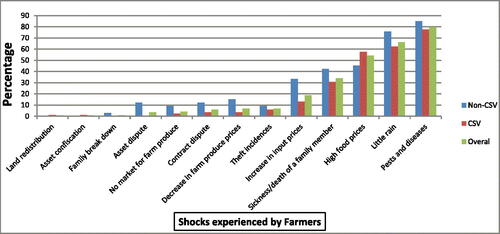
Figure 3. (a–e) Engel curves on wife and husband household expenditure ratios. Source: Author (2020).
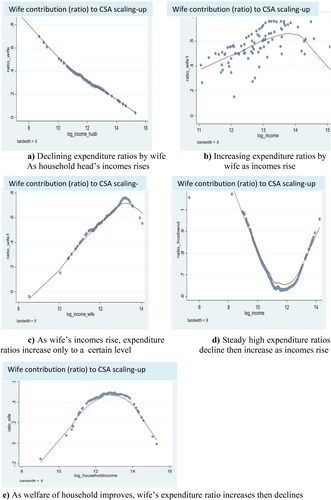
Table 2. ‘t-test’ Results on demographics in CSVs and NON-CSVs by respondents.
Table 3. Education level of respondents affecting CSA adoption rates of respondents.
Table 4. Distance to various markets.
Table 5. Binary Regression model results on determinants of CSA adoption/dis-adoption.
Table 6. Access to extension services (% of respondents).
Table 7. Group membership of respondents.
Figure 4. Group affiliation to larger organizations by respondents.
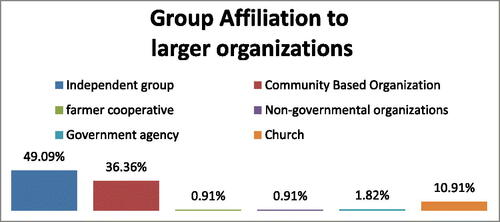
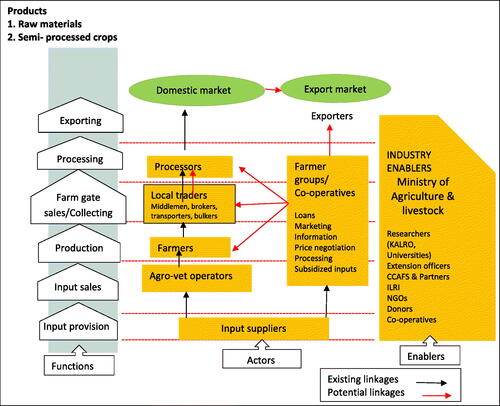
Figure 5. Value chain Map of farm produce in Nyando basin. Source: Field Observations, (2018–19).