
Figures & data
Table 1. List of local maize accessions collected from NAGRC, Khumaltar.
Table 2. ANOVA for nine quantitative traits.
Figure 1. Interaction of 30 maize accessions with error bars representing standard error for the trait ‘shoot length’ under irrigated (SL_I) and drought (SL_D) conditions. Interaction is significant at p ≥ .001.
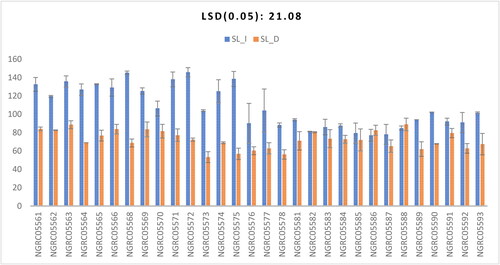
Table 3. Mean separation table for nine quantitative traits in 30 maize accessions.
Figure 2. Interaction of 30 maize accessions with error bars representing standard error for the trait ‘root length’ under irrigated (RL_I) and drought (RL_D) conditions. Interaction is significant at p ≥ .001.
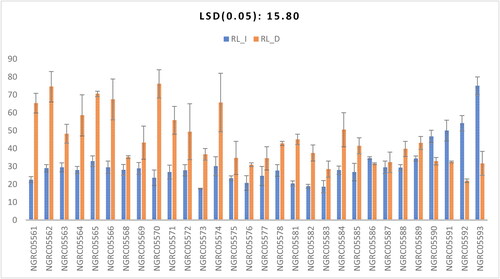
Figure 3. Mean performance comparison of 30 maize accessions with error bars representing standard error for the trait ‘root:shoot ratio’ under irrigated (R:S_I) and drought (R:S_D) conditions. Interaction is non-significant.
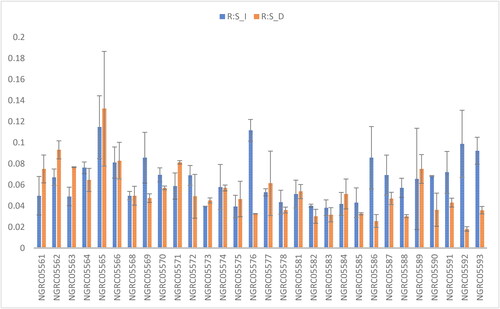
Figure 4. Mean performance comparison of 30 maize accessions with error bars representing standard error for the trait ‘number of roots’ under irrigated (NoR_I) and drought (NoR_D) conditions. Interaction is non-significant.
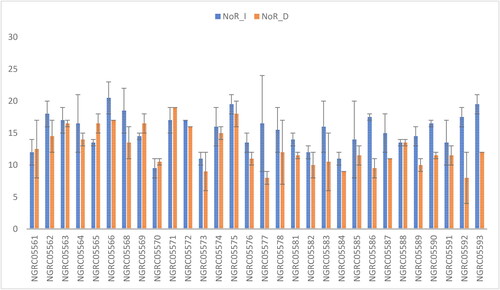
Figure 5. Interaction of 30 maize accessions with error bars representing standard error for the trait ‘root moisture content’ under irrigated (RMC_I) and drought (RMC_D) conditions. Interaction is significant at p ≥ .05.
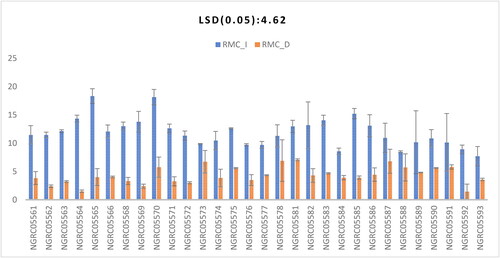
Figure 6. Interaction of 30 maize accessions with error bars representing standard error for the trait ‘shoot moisture content’ under irrigated (SMC_I) and drought (SMC_D) conditions. Interaction is significant at p ≥ .01.
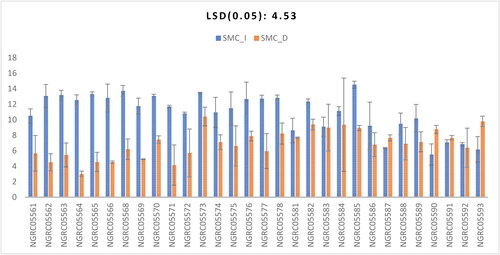
Figure 7. Mean performance comparison of 30 maize accessions with error bars representing standard error for the trait ‘relative water content’ under irrigated (RWC_I) and drought (RWC_D) conditions. Interaction is non-significant.
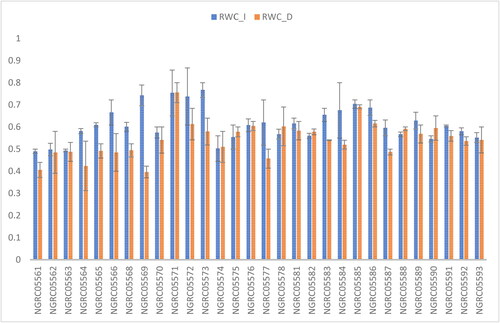
Figure 8. Interaction of 30 maize accessions with error bars representing standard error for the trait ‘root volume’ under irrigated (RV_I) and drought (RV_D) conditions. Interaction is significant at p ≥ .001.
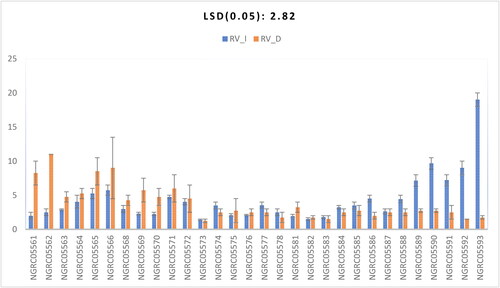
Figure 9. Mean performance comparison of 30 maize accessions with error bars representing standard error for the trait ‘NDVI’ under irrigated (NDVI_I) and drought (NDVI_D) conditions. Interaction is non-significant.
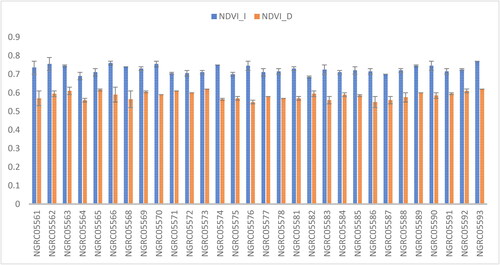
Table 4. Relative value of tolerance (RVT) for nine quantitative traits in 30 maize accessions.
Table 5. Correlation among plant growth attributes of 30 maize accessions under different growing conditions: drought condition (above diagonal) and irrigated condition (below diagonal).
Data availability statement
Data will be made available upon request via the corresponding email address.