
Figures & data
Table 1. The grass pea accessions used in the study with zonal, district, latitudinal, longitudinal, and altitudinal records.
Table 2. Analysis of variance (mean square) of 13 quantitative and one quality trait in 25 grass pea accessions grown at EBSU, CAS campus (2019).
Figure 1. The mean seed ODAP contents of 25 grass pea accessions were evaluated at EBSU, Abakaliki, Nigeria, in 2019.
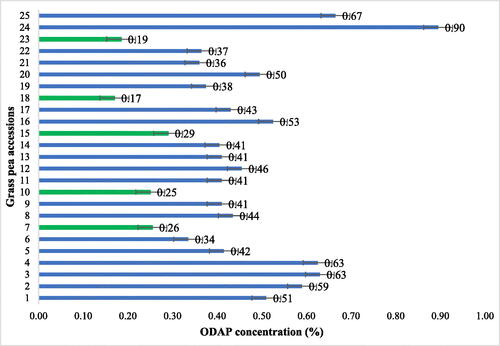
Table 3. Estimates of genetic parameters for 13 traits and ODAP among 25 accessions of grass pea evaluated at EBSU, CAS campus (2019).
Supplemental material
Supplemental Material
Download MS Word (44.2 KB)Data availability statement
The data backing up this finding can be obtained through the corresponding author, who will provide it upon reasonable request.