
Figures & data
Figure 1. Location map of the study area.
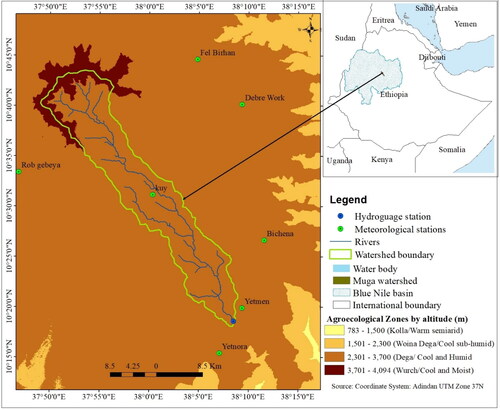
Table 1. Mean annual minimum and maximum temperature (oC) and precipitation (mm) for 1994–2022 and 2023–2055 periods.
Table 2. Land-use types of the study area.
Table 3. Dataset sources and types (1994, 2008, and 2022) and predicted LULC (2038).
Table 4. List of RCMs used in the CORDEX-Africa dataset for this study.
Figure 2. Flowchart representing the overall framework SWAT based modeling .
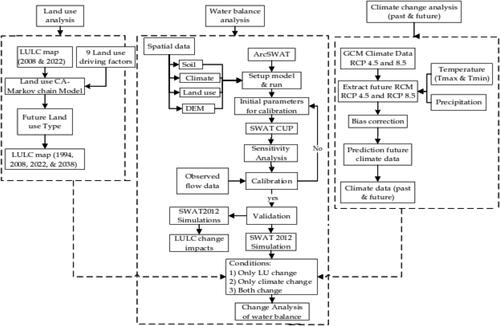
Table 5. Accuracy assessment for the years 1994, 2008, and 2022 classification.
Table 6. Spatial pattern of LULC change in the study watershed.
Table 7. Area coverage and percentage of LULC classes in Muga watershed.
Figure 3. LULC maps of 1994, 2008, 2022 and 2038.
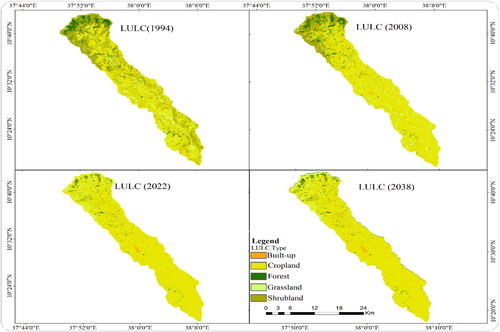
Table 8. List of parameters with fitted values and global sensitivity results for daily flow.
Figure 4. Sensitivity analysis of parameters for river discharge calibration, p-value shows the measure of sensitivity, the larger t-values are more sensitive. t-Test represents the significance of sensitivity, the smaller the p-value, the less chance of a parameter being by chance assigned as sensitive.
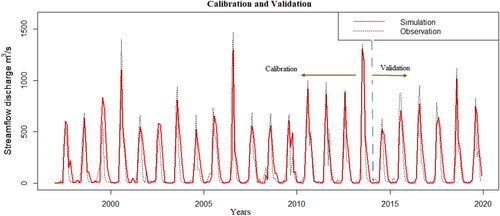
Figure 5. Simulated and observed streamflow for calibration and validation periods.
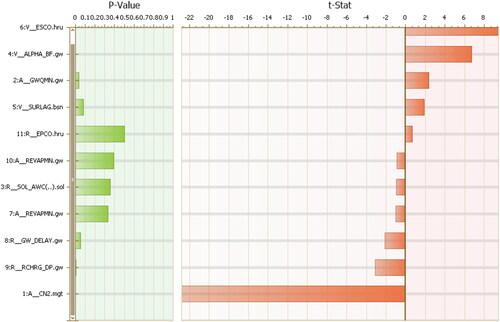
Table 9. SWAT model evaluation parameters for streamflow in the Muga watershed.
Table 10. Average annual evapotranspiration (ET), surface runoff (SURQ), groundwater (GWQ), water yield (WYLD), and lateral flow (LQ) change under four LULC scenarios and historical climate data (1994–2022).
Table 11. Predicted mean annual water balance components for different combinations of climate change and LULC scenarios.
Data availability statement
Data is available based on reasonable request from the authors.