
Figures & data
Figure 1. Conceptual framework for the spatial distribution of urban agricultural activities and farmers climate change adaptation strategies. Source: Authors Construct, 2023.
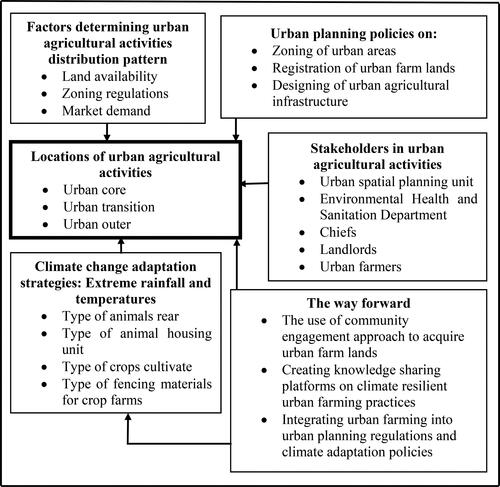
Figure 2. Study area map. Source: Author’s Construct, 2023.
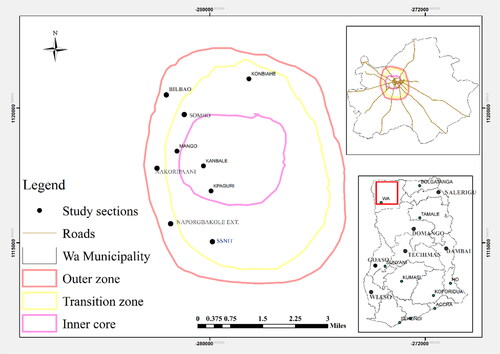
Figure 3. Spatial distribution of crop farm sizes in urban farming. Source: Field Work, 2023.
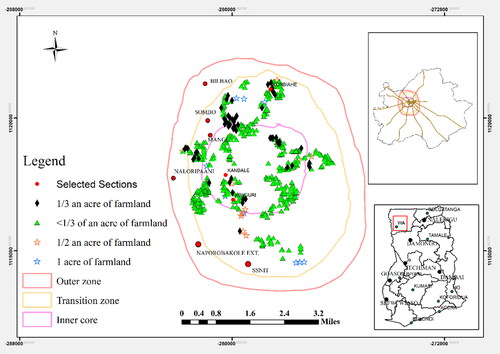
Figure 4. Spatial distribution of type of animals reared in urban farming. Source: Field Work, 2023.
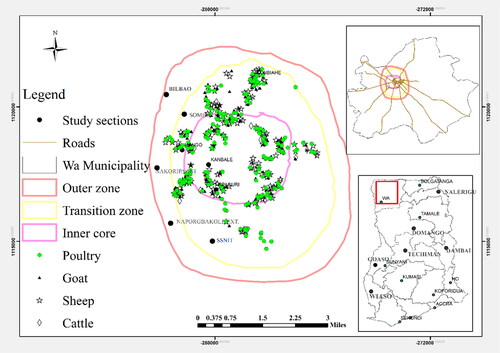
Figure 5. Spatial distribution of type of housing structure in urban farming. Source: Field Work, 2023.
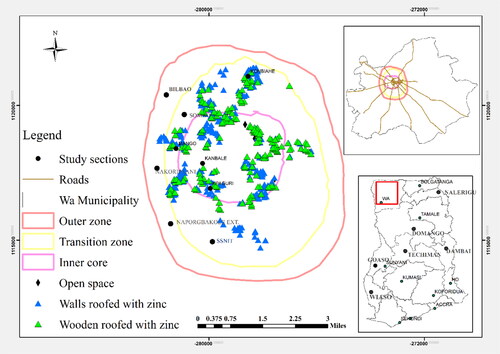
Table 1. Spatial statistics on the distribution of urban farm composition.
Data availability statement
The data that support the findings of this study are available from the corresponding author [GKN] upon reasonable request.