
Figures & data
Figure 1. Selected articles on soil greenhouse gas emissions from riparian systems between 1990 and 2022 from the Web of Science and Scopus databases.
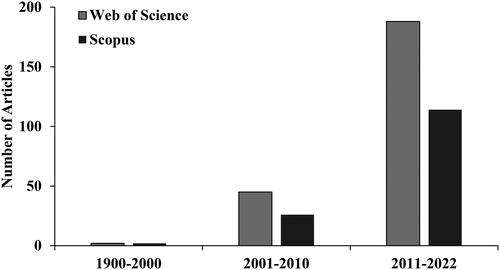
Table 1. Oxidation-reduction reactions and associated optimum redox potential values (adapted from Zhang & Furman, Citation2021), and optimum soil physicochemical properties (pH, water-filled pore space) contribute to the greenhouse gas (CO2, N2O, and CH4) emissions from soil.
Figure 2. Mean greenhouse gas emissions from soils under different climate and hydrological conditions (A); and mean soil emissions (all climates) under dry-wet conditions (B). Bar charts are standard errors. Bars (±SE) followed different letters in each hydrological condition, showing significant differences at p < 0.05. In this study, soil greenhouse gas emissions during the dry season and after flooding events/from saturated soils are considered dry and wet soil emissions, respectively. Source: Altor and Mitsch (Citation2006); Hernandez and Mitsch (Citation2006); McLain and Martens (Citation2006); Hinshaw and Dahlgren (Citation2016); Audet et al. (Citation2013); Kachenchart et al. (Citation2012); Lopes de Gerenyu et al. (Citation2011) (2015); Batson et al. (Citation2015); Jacinthe et al. (Citation2015); Mander et al. (Citation2015); Vidon et al. (Citation2017); Vidon et al. (Citation2016); Jacinthe and Vidon (Citation2017); Gebremichael et al. (Citation2017); Poblador et al. (Citation2017); Smith et al. (Citation2017); Kaiser et al. (Citation2018); Kandel et al. (Citation2019); Mafa-Attoye et al. (Citation2020); Schindler et al. (Citation2020); Liu et al. (Citation2021); Wang et al. (Citation2021); Mander et al. (Citation2022); Zhang et al. (Citation2022).
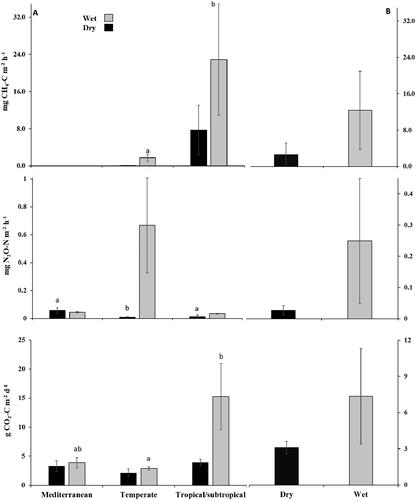
Table 2. Mean environmental properties in the reviewed riparian systems.
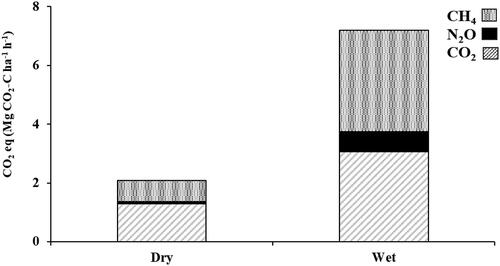
Figure 3. Soil CO2 eq of CO2, N2O, and CH4 from riparian systems under dry and wet soil conditions. Soil greenhouse gas emissions during the dry season and after flooding events/from wet soils are considered dry and wet soil emissions, respectively.
Data availability statement
The data that support the findings of this study are available from the corresponding author, [Jamshid Ansari], upon reasonable request.