
Figures & data
Figure 1. Study area map.
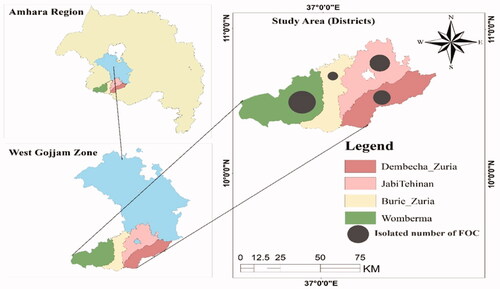
Table 1. Altitudinal range, mean minimum and maximum temperatures, total annual rainfall and mean relative humidity of studied areas in West Gojjam Zone, Ethiopia during 2021 main cropping seasons.
Figure 2. Procedures followed for sample collection and isolation of FOC from Pepper in Amhara region.
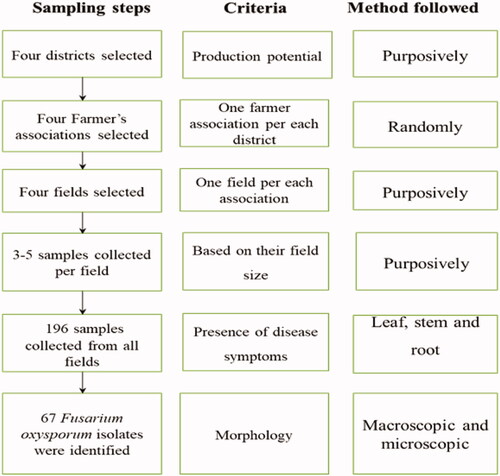
Figure 3. Symptoms of pepper wilt in the assessed field. (a) Wilted pepper plants; (b) Dead plants due to disease; (c) Dropped leaves and flowers; (d) Dark-brown vascular tissue discoloration 30 cm above the base of plants. The photos were taken during the experiment by the first author– Tadesse Tilahun.
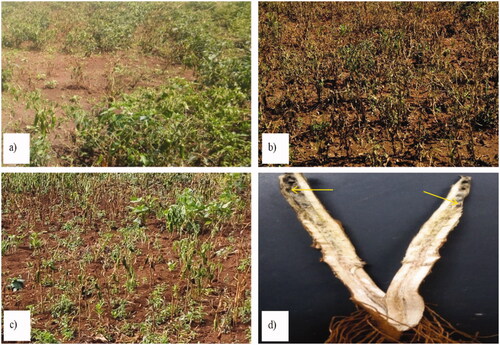
Table 2. Number of samples collected and the proportion of isolates in the district and study area.
Table 3. Statistical test/analysis of incidence and severity.
Figure 4. The relationship between disease incidence and severity index in the study area in each district.
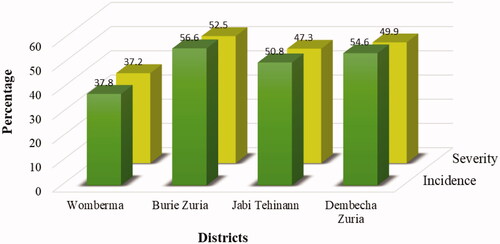
Figure 5. Colony color of some representative pictures of the culture (a) White, (b) Cottony white, (c) Creamy white, (d) Light Pink, (e) Pink.
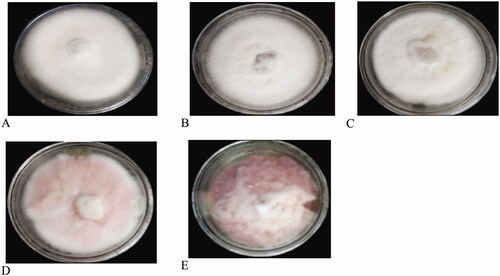
Figure 6. Colony shape (A&B), margin (C&D), and growth (E&F) pattern of FOC cultures. (a) Circular, (b) Filamentous, (c) Entire, (d) Filiform, (e) Fluffy, (f) Adherent smooth.
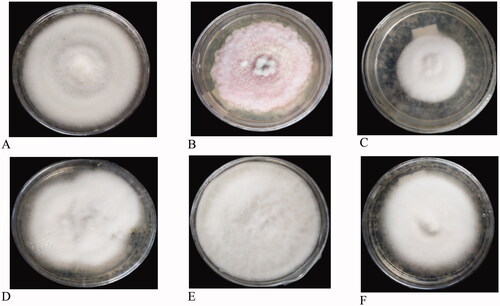
Figure 7. Comparison of each colony characteristics of FOC isolates in West Gojjam Zone of Ethiopia.
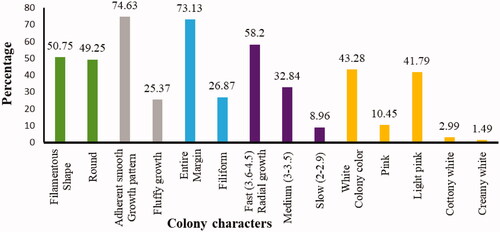
Table 4. The number of FOC isolates with morphological characteristics.
Figure 8. Microscopic characteristics of FOC isolates. (a) Oval to kidney-shaped microconidia, (b) Slightly curved, thick-walled, and septated macroconidia, (c) Intercalary chlamydospore, (d) Paired terminal chlamydospore.
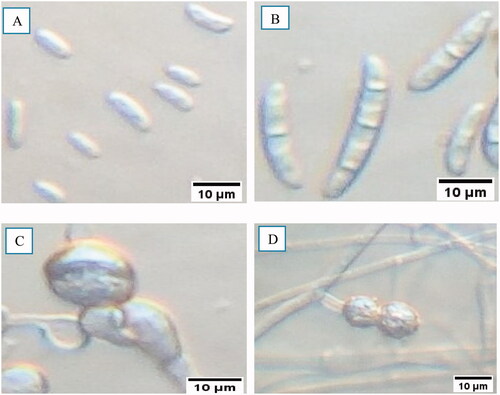
Table 5. Microscopic features of FOC isolates collected from diseased pepper plants.
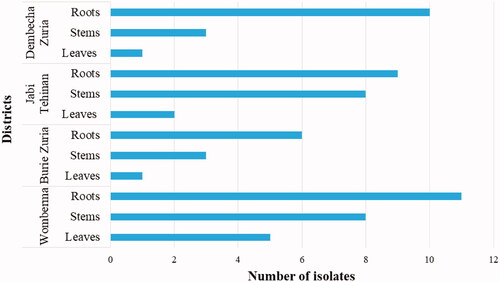
Figure 9. The frequency of FOC abundance in each part of pepper plant.
Data availability statement
The data that support the findings of this study are available in [Science Data Bank at http://doi.org/10.57760/sciencedb.0306.], reference number [10.57760/sciencedb.03069].