
Figures & data
Figure 1. Theory of Change: Showing a logic of GI-labelled sugar beans production to assess the profit effect (Source: Adopted from Pamuk et al., Citation2022).
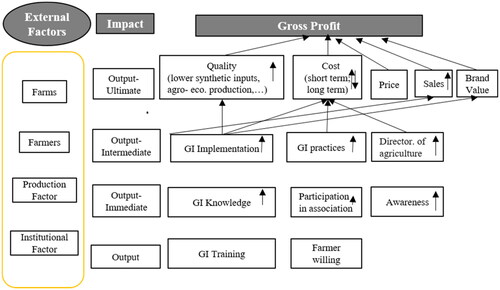
Table 1. Variables compare enterprises.
Table 2. Variable costs per decare and their distribution.
Table 3. Gross output, variable costs and gross profit.
Table 4. Descriptive statistics of variables for comparing enterprises.
Table 5. ATE and ATET values by gross output.
Graph 1. Covariate balance plot by gross output (gross income) per decare of the enterprises.
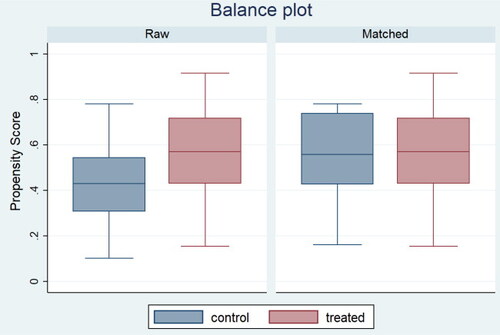
Table 6. ATE and ATET values by the gross profit per decare.
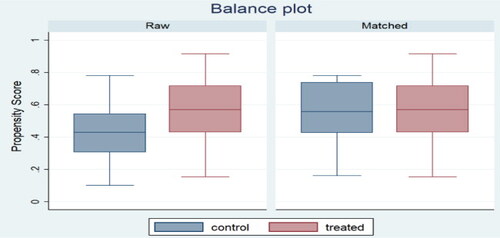
Graph 2. Covariate balance plot by gross profit per decare of the enterprises.
Data availability statement
The data that support the findings of this study are available on request from the corresponding author, [ND]. The data are not publicly available due to [restrictions e.g. their containing information that could compromise the privacy of research participants].