
Figures & data
Table 1. Classification of salt-affected soils based on chemical properties (Daba & Qureshi, Citation2021).
Table 2. Extent of salt affected soils in some African countries.
Table 3. Salinity threshold levels for rice compared with other field crops.
Figure 1. The common mechanisms involved in rice salt tolerance stress response (Liu et al., Citation2023).
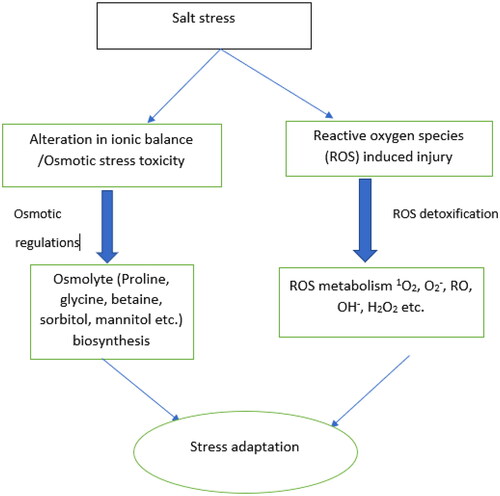
Figure 2. Salinity response adaptations in plants, extracted from Hussain et al. (Citation2019).
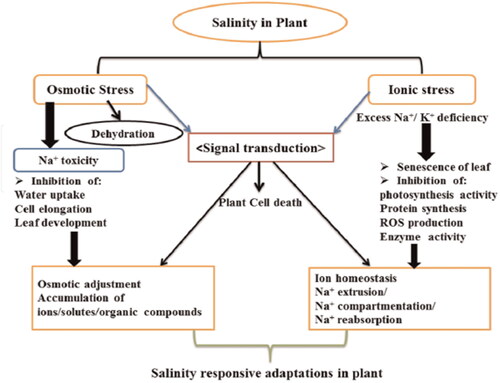
Table 4. Rice genotypes tolerant to salinity identified in different Africa countries.
Figure 3. Chromosome wise reported quantitative trait loci (QTL) for salt tolerance (Singh et al., Citation2021).
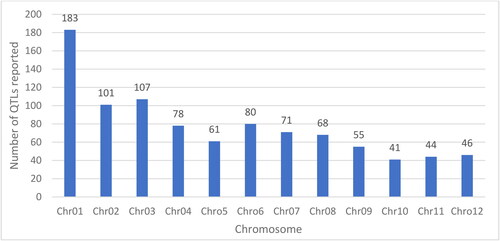
Table 5. The CRISPR/Cas9 system for enhancing salinity tolerance in rice.
Table 6. Improving salinity stress tolerance in rice using a genetic engineering approach.