
Figures & data
Figure 1. Location and topography of the study area.
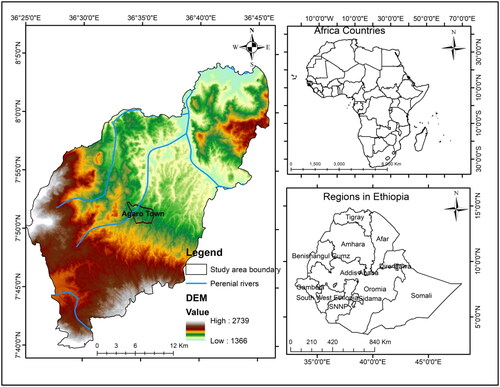
Table 1. Source, description and purpose of the data used in the study.
Figure 2. Land cover map (a), LULC suitability status (b), Slope map (c), Slope suitability status (d), Soil map (e), and Soil suitability status (f). Where CF is coffee farm with shade trees; ICL: intensively cultivated land; MCL: moderately cultivated land; NFC: natural forest cover; NFCC: natural forest cover with coffee; OWL: open wood; RF: riverine forest; SGL: savanna grassland; St: settlement; AS: acrisols; AS-LS: acri-lixisols; CS: cambisols; FS-LS: Fluvial-lixisols; LS: leptosols; NS: nitosols; VS: vertisols; LiS: lixisols.
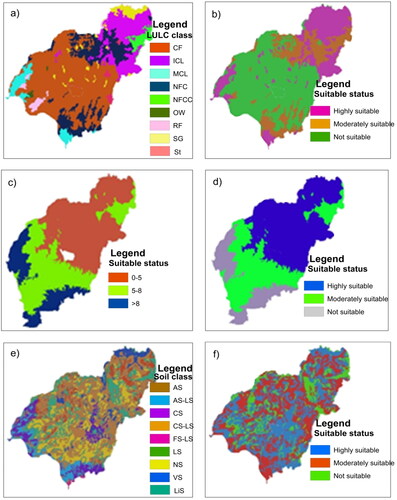
Table 2. Land cover evaluation suitability criteria description.
Table 3. Slope suitability status.
Figure 3. Climate data in relation to the agro-ecological zones in the study area.
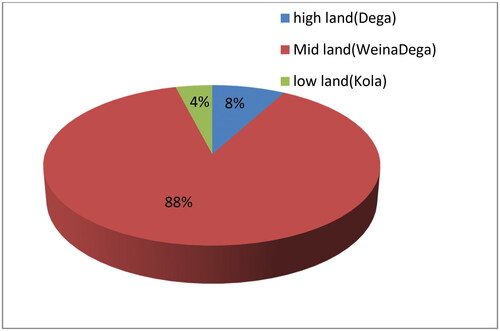
Table 4. Rainfall suitability status.
Table 5. Drainage density suitability status.
Table 6. Pair wise comparison matrix for irrigation suitability analysis.
Figure 4. Optimal suitable land for SWI potential for small holder farmers in the district.
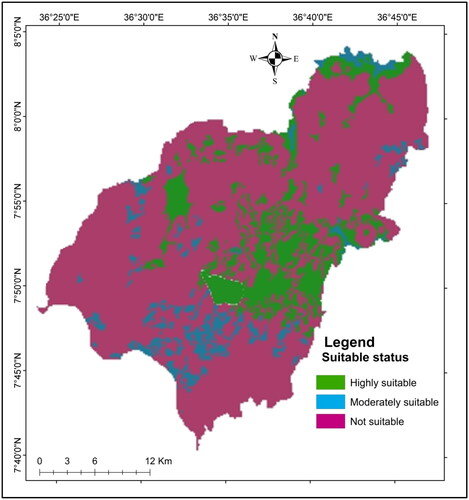
Table 7. The overall SWI potential possibilities in the study area.
Table 8. Irrigable and climatic zone of the study area.
Data availability statement
The data is included in the manuscript.