
Figures & data
Table 1. Formulation of experimental diets.
Table 2. Percentage proximate composition of moringa leaf, ginger and garlic powder.
Table 3. Primers used for nucleic acid quantification and qPCR in this study.
Table 4. Growth performance and nutrient utilization of experimental fish.
Figure 1. Gel image capture cDNA quantification of samples done in triplicate, GAPDH with expected amplicons band size of 450 bp.
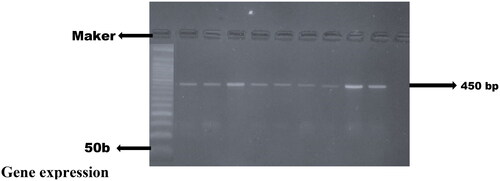
Table 5. Nucleic acid quantification showing the Δ260/280 values and concentrations in ng/µl of RNA isolated from Clarias gariepinus.
Table 6. The gene expression level of different experimental fish fed with different fed supplements.