
Figures & data
Figure 1. Conceptual model.
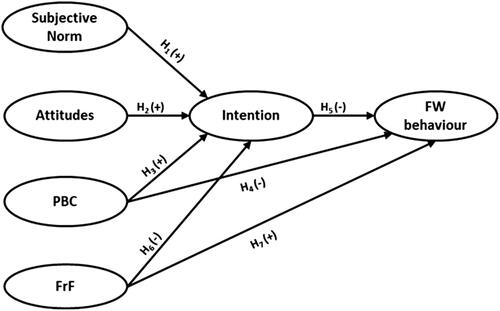
Table 1. The sources of constructs and the items.
Table 2. Sociodemographic characteristics of the participants (N = 520).
Table 3. Factor loadings from Confirmatory Factor Analysis (CFA) and construct reliability.
Table 4. Discriminant validity assessment (n = 520).
Table 5. The explanatory power of the original and the extended TPB model.
Table 6. Structural model results.
Figure 2. The original structural model of food waste behaviour. Note: The model allows covariation between Subjective norms, Attitudes, and PBC. Goodness of fit indices: χ2/df = 3.545; CFI = 0.946; GFI = 0.925; AGFI = 0.893; TLI = 0.932; SRMR= 0.0662; RMSEA = 0.070; p < 0.05. ***p < 0.001. N = 520. R2: squared multiple correlations.
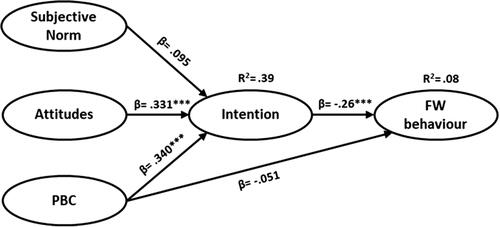
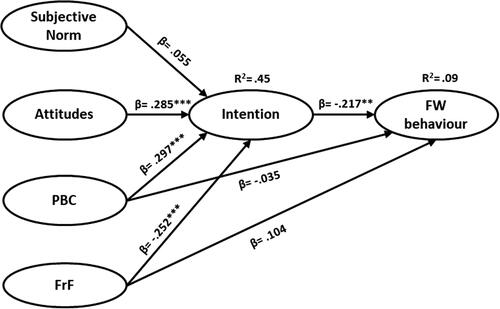
Figure 3. The extended structural model of food waste behaviour. Note: The model allows covariation between Subjective norms, Attitudes, PBC and FrF. Goodness of fit indices: χ2/df = 2.972; CFI = 0.942; GFI = 0.917; AGFI = 0.889; TLI = 0.930; SRMR= 0.0618; RMSEA = 0.062; p < 0.05. ***p < 0.001; **p < 0.01. N = 520. R2 = squared multiple correlations.
Appendix.docx
Download MS Word (32.9 KB)Data availability statement
The data that support the findings of this study are available from the corresponding author, M.M., upon reasonable request.