429
Views
0
CrossRef citations to date
0
Altmetric
Soil & Crop Sciences

Multicriteria land suitability assessment for cassava and bean production using integration of GIS and AHP

ORCID Icon, ORCID Icon, ORCID Icon, ORCID Icon, ORCID Icon, ORCID Icon & ORCID Icon show all
Article: 2333316 | Received 02 Feb 2024, Accepted 18 Mar 2024, Published online: 27 Mar 2024

Figures & data

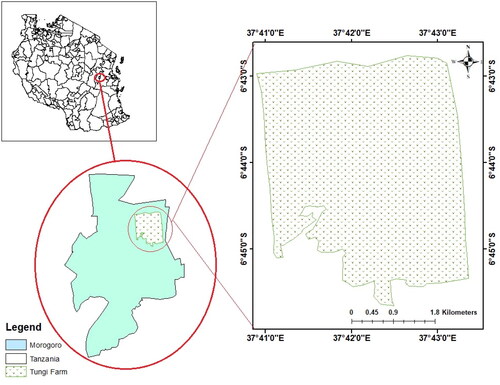
Figure 1. Study area.

Figure 1. Study area.

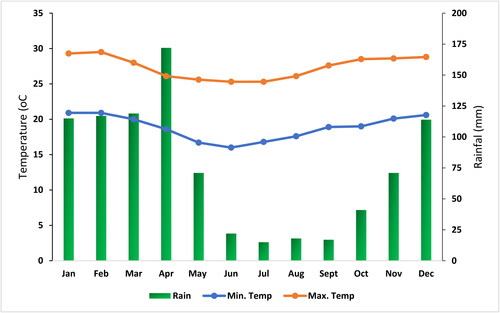
Figure 2. Mean monthly rainfall and temperatures (1991–2021) for the study area.

Figure 2. Mean monthly rainfall and temperatures (1991–2021) for the study area.

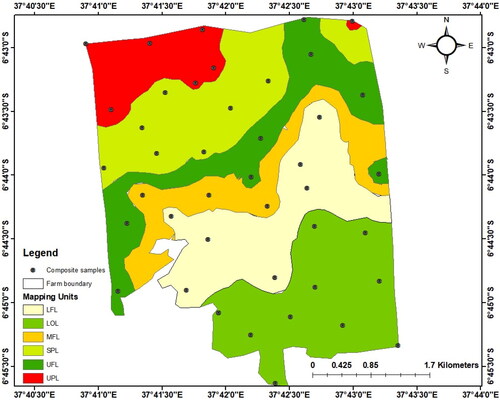
Figure 3. Mapping units and their respective composite samples.

Figure 3. Mapping units and their respective composite samples.

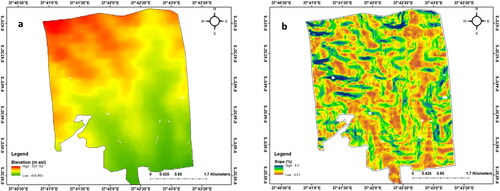
Figure 4. Digital elevation map (a) and slope map (b).

Figure 4. Digital elevation map (a) and slope map (b).

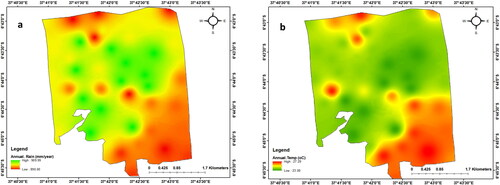
Figure 5. Rainfall map (a), and temperature map (b).

Figure 5. Rainfall map (a), and temperature map (b).

Table 1. Suitability classes.

Table 2. Criteria requirement for bean production.

Table 3. Criteria requirement for cassava production.

Table 4. The Saaty’s rating scale.

Table 5. Random Consistency Index (RCI).

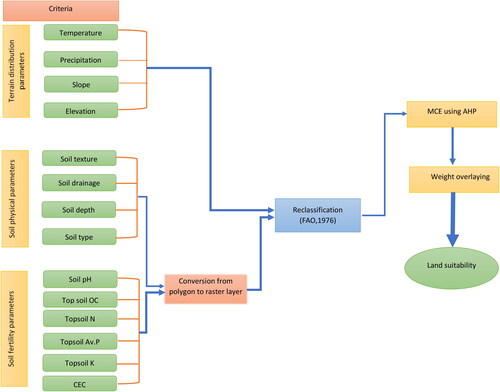
Figure 6. Methodological flowchart for bean and cassava suitability assessment.

Figure 6. Methodological flowchart for bean and cassava suitability assessment.

Table 6. AHP pairwise comparison matrix for bean production.

Table 7. AHP pairwise comparison matrix for cassava production.

Table 8. Main Criteria Pairwise comparison matrix and ranking for bean and cassava production.

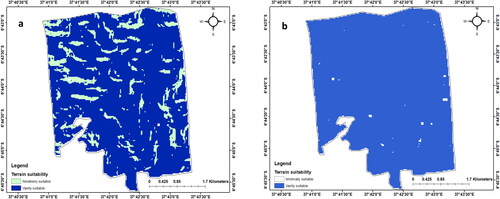
Figure 7. Terrain distribution suitability map for bean (a) and cassava (b).

Figure 7. Terrain distribution suitability map for bean (a) and cassava (b).

Table 9. Area percent coverage of the main parameter for land suitability assessment of bean and cassava crop.

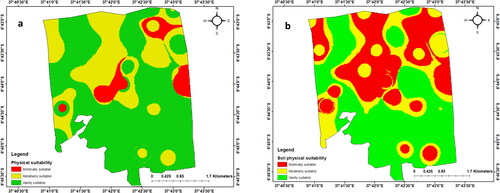
Figure 8. Soil physical parameters suitability map for bean (a) and cassava (b).

Figure 8. Soil physical parameters suitability map for bean (a) and cassava (b).

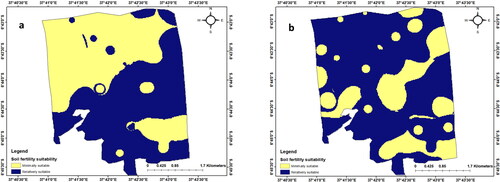
Figure 9. Soil fertility parameters map for bean (a) and cassava (b).

Figure 9. Soil fertility parameters map for bean (a) and cassava (b).

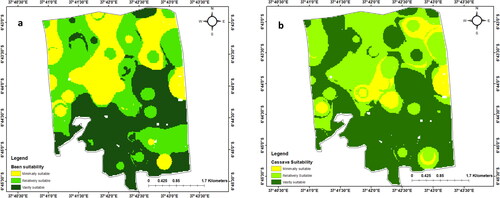
Figure 10. Suitability map for bean (a) and cassava (b).

Figure 10. Suitability map for bean (a) and cassava (b).

Table 10. Suitability and area coverage of Tungi Farm for bean and cassava production.

Data availability statement

Data are available from the corresponding author upon reasonable request.