Figures & data
Figure 1. Location of samples collected in each of the Canary Islands. Organic samples are shown in green and conventional samples in red.
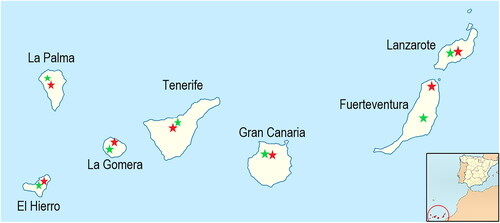
Table 1. Sample description including codification, island of provenance, type of wine, production method, harvest, grape variety, location and soil type.
Table 2. Average values of soil parameters per island comprising both organic and conventional management systems.
Figure 2. Variation in the soil variables measured from conventional management (C) and organic management (E) vineyards. See for codes and concentration units of each variable.
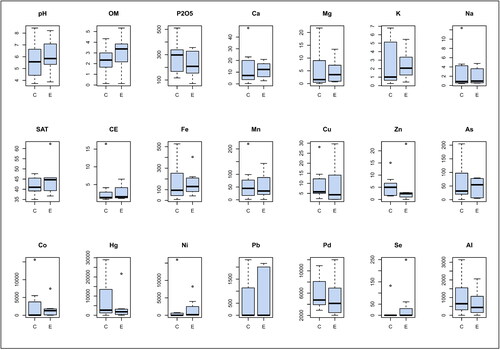
Figure 3. Principal components analyses ordinations of the vineyard samples according to the variation in the soil variables measured. (A) variable contribution to two main principal components and (B–D) vineyard samples ordinations grouped by management type (conventional, C; organic, E), type of wine (Red; White) and the island of origin (El Hierro, EH; La Palma, LP; La Gomera, LG; Tenerife, TF; Gran Canaria, GC; Fuerteventura, FT; Lanzarote, LZ) respectively. See Supporting Information Table S1 for variable codes in A.
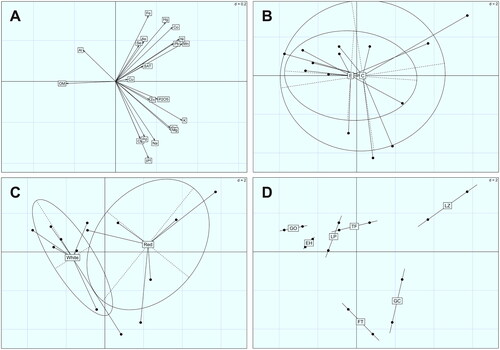
Table 3. Average values of wine parameters per island comprising both organic and conventional management systems.
Figure 4. Variation in the wine variables measured from conventional management (C) and organic management (E) vineyards. See for codes and concentration units of each variable.
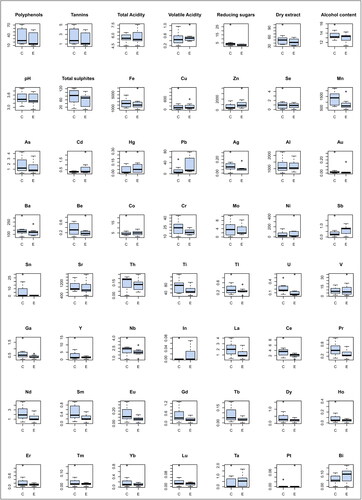
Figure 5. Principal components analyses ordinations of the vineyard samples according to the variation in the wine variables measured. (A) variable contribution to two main principal components and (B–D) vineyard samples ordinations grouped by management type (conventional, C; organic, E), type of wine (Red; White) and the island of origin (El Hierro, EH; La Palma, LP; La Gomera, LG; Tenerife, TF; Gran Canaria, GC; Fuerteventura, FT; Lanzarote, LZ) respectively. See Supporting Information Table S1 for variable codes in A.
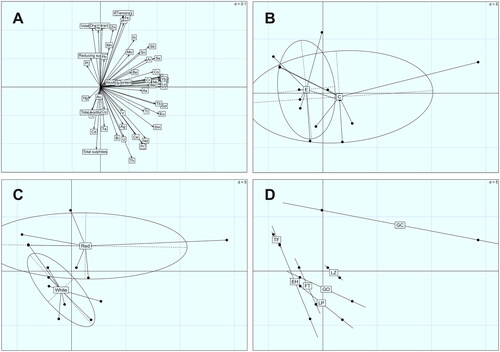
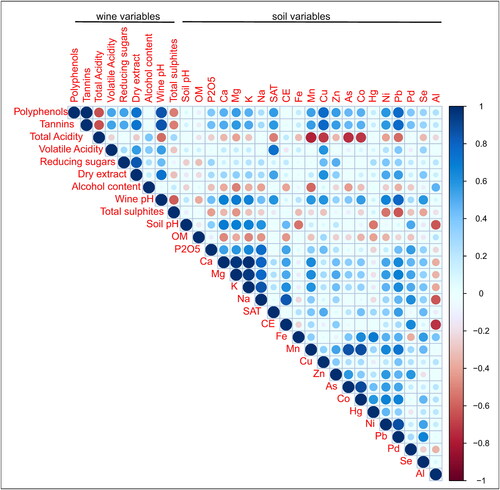
Figure 6. Correlation plot between all pairs of the wine variables (nine main variables) and soil variables (21) measured. Color scale according to Spearman correlation coefficient (r) and circle size absolute r values. See Supporting Information Table S1 for variable codes.