
Figures & data
Figure 1. Map showing the study area.
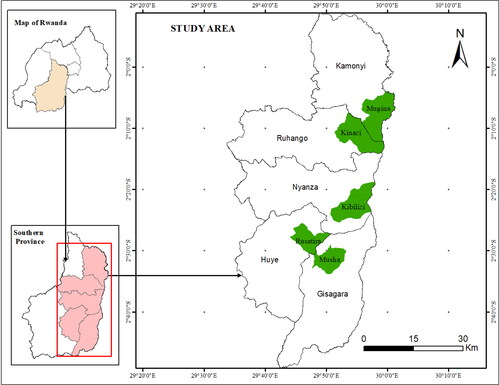
Table 1. Distribution of sample households by cells.
Table 2. Reliability coefficient values of different climate change components.
Table 3. Description of independent variables used in the model.
Table 4. Demographic and socioeconomic characteristics of respondents (continues variables).
Table 5. Demographic and socioeconomic characteristics of respondents (discrete variables).
Table 6. Farmers’ perceptions on human actions’ causes of climate change.
Table 7. Farmers’ perceptions on the trends of temperature and rainfall over the period of 30 years.
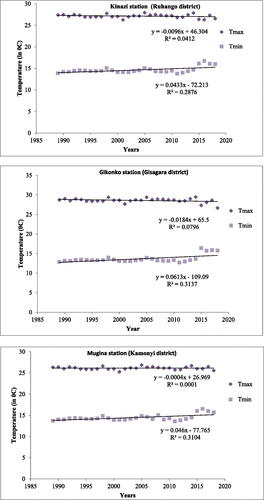
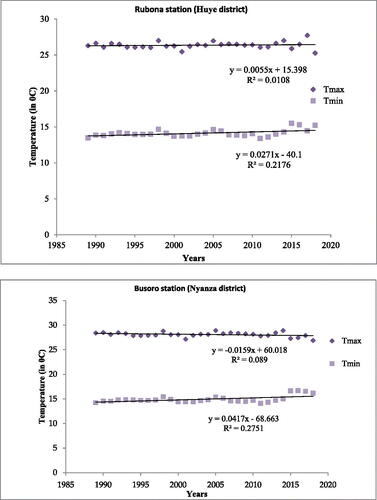
Table 8. Sen’s slope values for seasonal and annual rainfall in central plateau zone of Rwanda (1989–2018).
Table 9. Farmers’ perceptions on climate change shocks, shocks’ effects, and coping strategies.
Table 10. Farmers’ perceptions on the effects of climate change on sorghum.
Table 11. Sorghum farmers’ adaptation strategies.
Table 12. Results of multivariate probit model for adoption of climate change adaptation strategies.