
Figures & data
Table 1. Summary of survey response rate.
Table 2. Summary of between-wave attrition.
Table 3. Reasons for attrition, percentage of participants who did not take part in the survey after R1.
Figure 1. Trends in dietary intake during the COVID-19 pandemic.
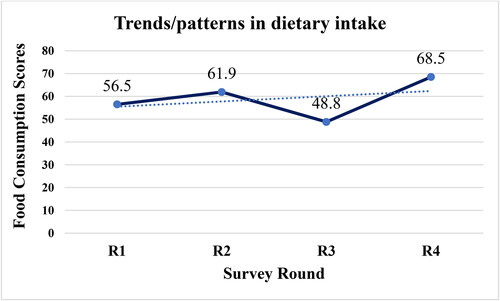
Table 4. Household demographic characteristics.
Table 5. FCG by survey wave.
Figure 2. Household dietary transitions.
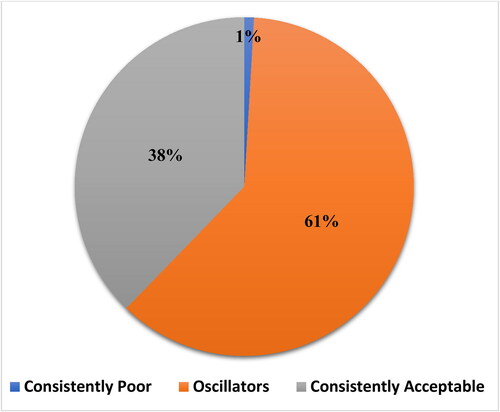
Figure 3. Food consumption trends of oscillator households across survey waves.
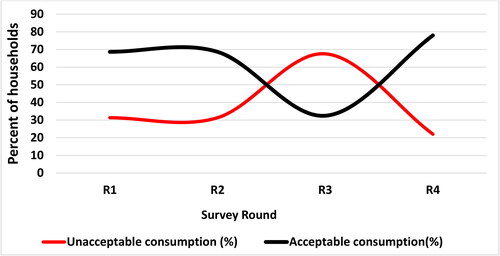
Table 6. Summary of response strategies used by urban slum households during COVID-19 pandemic.
Table 7. Effects of response strategies on household food consumption scores.
Figure A1. FCGs and weights. Source: WFP (Citation2006).
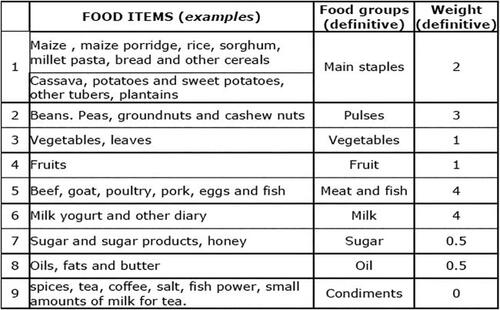
Table A1. Confirmatory attrition bias analysis using logistic regression.
Table A2. Proportions of households consuming different food categories over the survey waves.
Table A3. Frequency of consumption of different food categories in 7 d over the survey waves.