
Figures & data
Figure 1. Map of the study area.
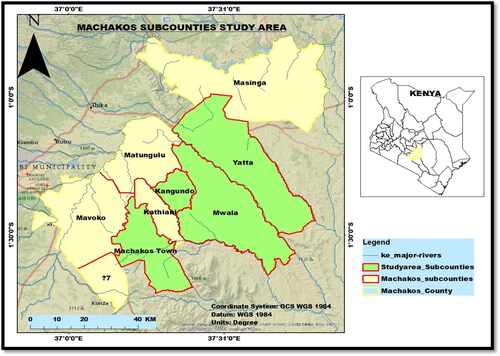
Table 1. Definitions of variables and the expected signs for the double hurdle model.
Table 2. Descriptive statistics for the continuous variables.
Table 3. Descriptive statistics for binary and categorical variables (chi2-test).
Table 4. A double hurdle (probit + truncated model) versus the Tobit model estimates.
Annex 1. T-statistics on double hurdle (probit + truncated model) versus Tobit model.
Annex 2. Status of adoption of ic production technologies.
Data availability statement
The data used for this study is available from the corresponding author upon request.