
Figures & data
Table 1. Review of related work.
Figure 1. Schematic representation of an LSTM RNN Cell.
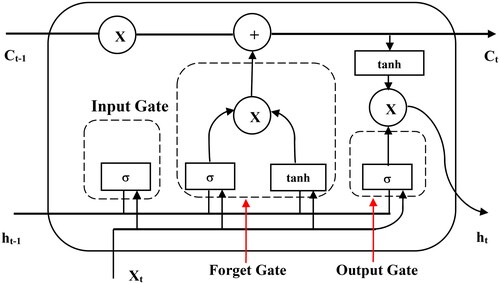
Figure 2. Research methodology of the study.
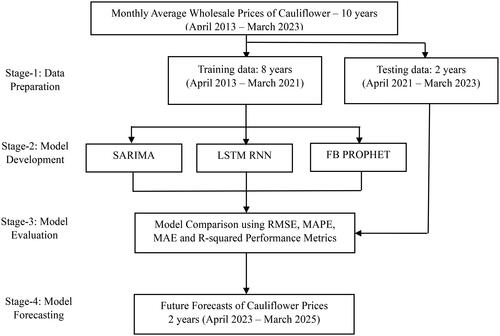
Figure 3. a) Time-series plot of prices of cauliflower (April 2013 to March 2023); b) Seasonal, trend and residual decomposition of time-series data.
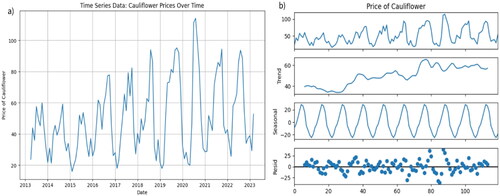
Table 2. Unit root test for prices of cauliflower.
Figure 4. ACF and PACF plots of seasonally differenced data.
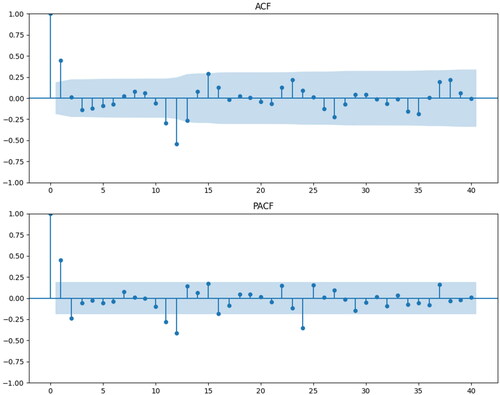
Table 3. Model estimation with AIC, BIC, RMSE and MAPE criterion for SARIMA (p, 0, q) (P, 1, Q)12.
Table 4. Parameter estimators of SARIMA (0, 0, 1) (3, 1, 0)12.
Figure 5. a) Residual ACF and PACF plots of SARIMA (0 0, 1) (3, 1, 0)12; b) residual time-series plot.
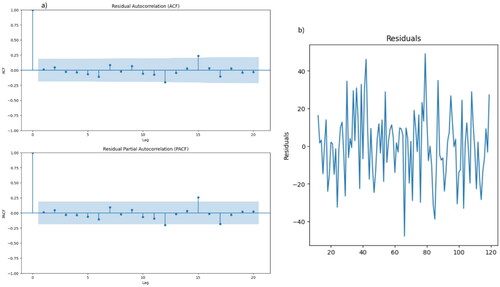
Table 5. Number of neurons and Epochs considered in five LSTM RNN models.
Figure 6. Loss per Epoch during training of LSTM1 model.
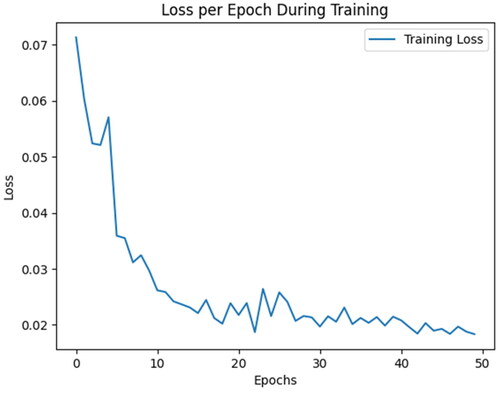
Table 6. Comparison of in-sample and out-sample performances of SARIMA, LSTM RNN and Fb Prophet models.
Figure 7. Comparison of actual vs. predicted test data of different models.
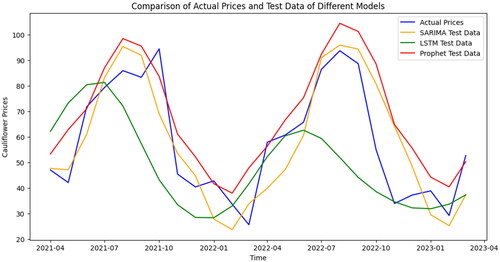
Figure 8. a) Forecasts using SARIMA model, b) Forecasts using Fb Prophet model and c) Forecasts using LSTM RNN model.
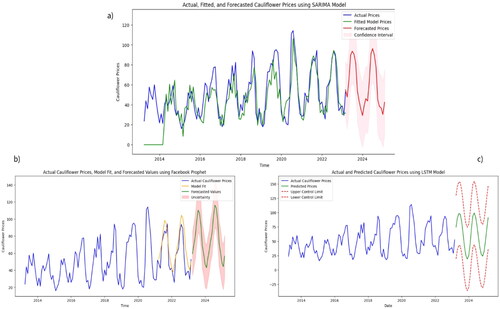
Table 7. Future forecasts of cauliflower prices using different models.
SARIMA_Cauliflower.xlsx
Download MS Excel (12.3 KB)Source_Codes_for_Google_Colab.docx
Download MS Word (37.7 KB)Future Forecasts.xlsx
Download MS Excel (9.5 KB)Test_data.xlsx
Download MS Excel (10.5 KB)Availability of supporting data
All data generated or analysed during this study are included in this article and its Supplementary Information files.