
Figures & data
Table 1. Constructs, definitions and their measurement.
Figure 1. Modified UTAUT model.
Source: Dwivedi et al. (Citation2019).
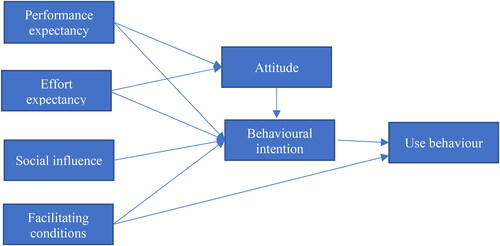
Figure 2. The SEM model.
Source: Stein et al. (Citation2012).
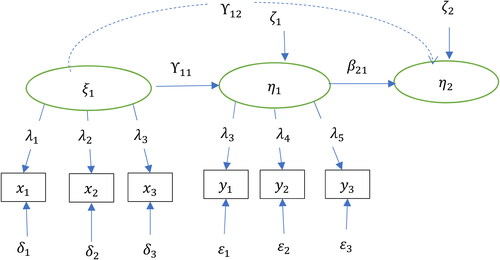
Figure 3. Structural model.
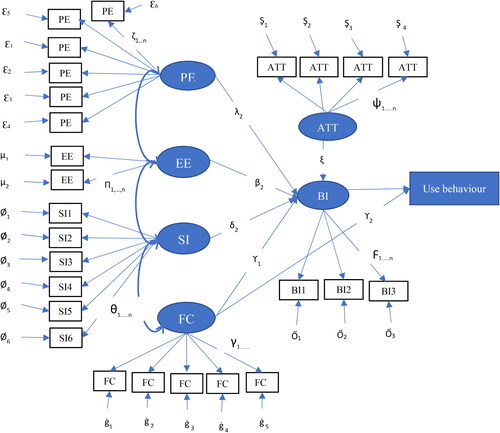
Table 2. Farmer perception of SIP adoption.
Table 3. Available SIPs, farmers’ understanding of the role in mitigating effects of climate variability and associated constraints.
Table 4. Model fit statistics.
Table 5. Test of reliability.
Table 6. Output from SEM (direct effects).
Table 7. Path analysis for hypothesis testing.