Figures & data
Table 1. Development of fruit flies at different concentrations of CuSO4.
Figure 1. The decline in learning and memory ability of copper-treated larvae. The F1, F2, and F3 flies were independently trained in two sections, which were prepared using the odors n-amyl acetate, and 1-octanol. The control was the flier fed in the negative copper medium. LI was calculated by the relation of preferable AM or OCT indicated in EquationEquations (1)–(3). LI score > 0 indicated appetitive learning; LI score ∼ 0 indicated no evidence of learning and memory; if the LI score < 0, aversive learning had occurred. The values are introduced as the average ± amount of variation of triplicate experiments, and the difference was measured using t–test (p** <0.01; p***<0.001).
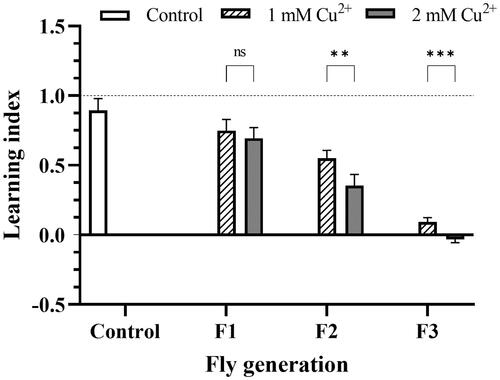
Figure 2. Copper caused locomotor impairment in flies. Twenty randomly chosen adult flies were placed in the bottom of 2 × 10 cm vials as a common starting point for each treatment group. The control was described in the legend of . The proportion of flies that could reach the 6 cm height column in 10 s was recorded. Data are introduced as the mean ± standard deviation of five independent experiments and difference was measured using the t–test (p*<0.05; p** <0.01; p***<0.001; p****<0.0001).
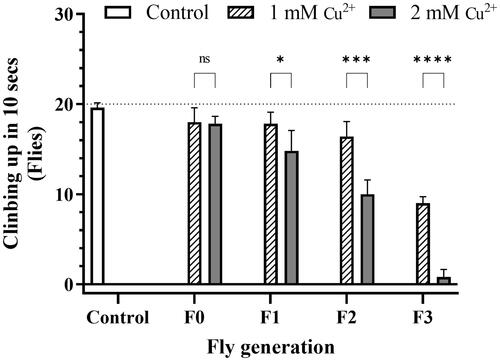
Figure 3. Protein concentration of the treatments. The flies were prepared by homogenized protein concentration in the different concentrations of CuSO4 (1 mM and 2 mM). The control was described in the legend of . Bradford’s method using BSA as the standard was applied to estimate the treatments. The values are introduced as the average ± amount of variation of triplicate experiments, and the difference was measured using the t–test and 2-way ANOVA.
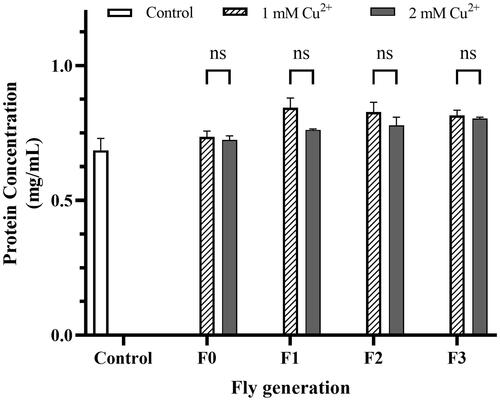
Figure 4. DPPH scavenging percentage reduction by copper toxicity. The mixture containing 20 µL of fly homogenized sample and 50 µL methanol (Blank) added 125 µL of 0.004% DPPH solution was kept warm in the dark for 30 min at room condition and measured OD at the wavelength of 517 nm. The mixture using the homogenized flies grown in the negative copper medium was used as a control. The DPPH scavenging percentage was calculated by EquationEq. (4)(4)
(4) , presented in Materials and Methods. The values are introduced as the average ± amount of variation of triplicate experiments, and the difference was measured using the 2-way ANOVA and the t-test. For 1 mM Cu2+ p = 0.033 F0, p = 0.009 F1, p = 0.010 F2, p = 0.005 F3 vs. Control, respectively; for 2 mM Cu2+ p = 0.023 F0, p = 0.003 F1, p = 0.005 F2, p = 0.000 F3 vs. Control, respectively.
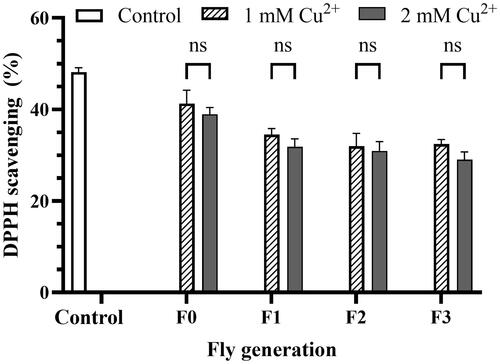
Figure 5. Copper induces catalase inhibition. The effect of 1 mM (A) and 2 mM (B) Cu2+ on catalase activity of variant fly generation, respectively. (C) the effect of Cu2+ on the specific catalase activity per minute of the flies. The values are introduced as the average ± amount of variation of triplicate experiments, Nonline fit Michaelis-Menten model, and the difference was measured using the 2-way ANOVA and the t-test. The reaction mixture in a cuvette, containing 100 µL of fly homogenized sample and 900 µL of 50 mM sodium phosphate buffer, was measured OD at the wavelength of 240 nm, then adding 500 µL of H2O2 solution and measured OD immediately. The OD value was read every 1 min for 3 min. The 100 mL of 30 mM H2O2 in 50 mM buffer phosphate was used as blank. The control was showed in the legend of . Enzyme activity (p* < 0.05; p** < 0.01; p*** < 0.001; p**** < 0.0001) was calculated by EquationEq. (5)(5)
(5) as described in Materials and Methods. (C) For 1 mM Cu2+: p = 0.030 F1, p = 0.0224 F2, p = 0.0127 F3 vs. Control, respectively; for 2 mM Cu2+: p = 0.010 F1, p = 0.004 F2, p = 0.005 F3 vs. Control, respectively.
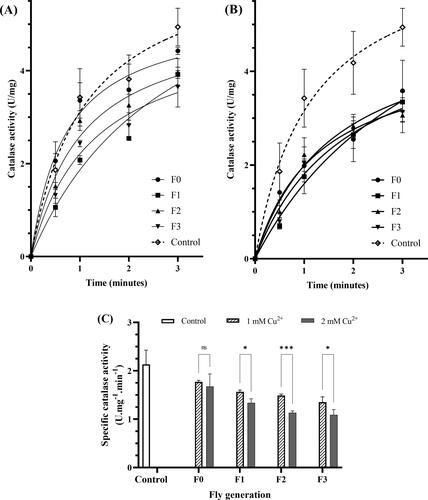
Figure 6. Copper induces AChE inhibition. The reaction mixture consisted of 10 µL of fly homogenizer, 10 µL of acetylcholine chloride in 2.6 mM methanol, and 200 µL of 0.1 mM, pH 7.0 sodium phosphate buffer. Measure OD at the wavelength of 405 nm to get blank and add 80 µL of 0.3% Fast blue B salt to the mixture and measure OD at the wavelength every 5 min for 20 min. Protein concentration of the samples helped to standardization of the results. The control was described in the legend of . Enzyme activity was calculated by EquationEq. (6)(6)
(6) , described in Materials and Methods. The values are introduced as the average ± amount of variation of triplicate experiments, and the difference was measured using the 2-way ANOVA and the t-test. For 1 mM Cu2+: p = 0.0022 F0, p = 0.0014 F1, p = 0.0030 F2, p = 0.0006 F3 vs. Control, respectively; for 2 mM Cu2+ p = 0.0015 F0, p = 0.0008 F1, p = 0.0008 F2, p = 0.0006 F3 vs. Control, respectively.
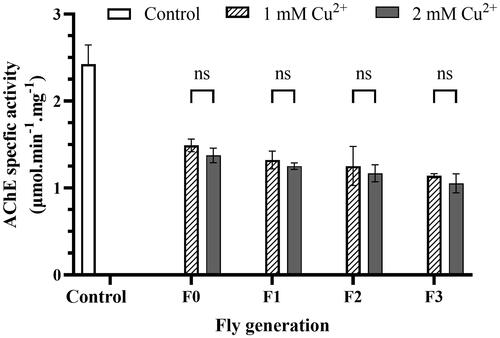
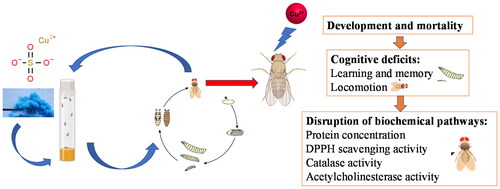
Figure 7. The toxicity of copper metal (Cu) on flies through behavioral and biochemical assays.