
Figures & data
Figure 1. The study location and area.
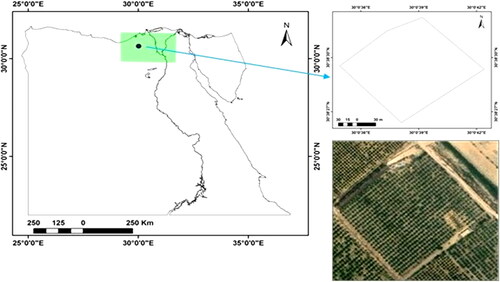
Figure 2. NASA’s POWER Data Access Viewer.
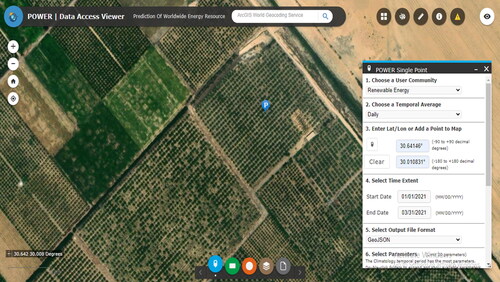
Figure 3. Flowchart of ETo prediction algorithm for the prediction of ETo.
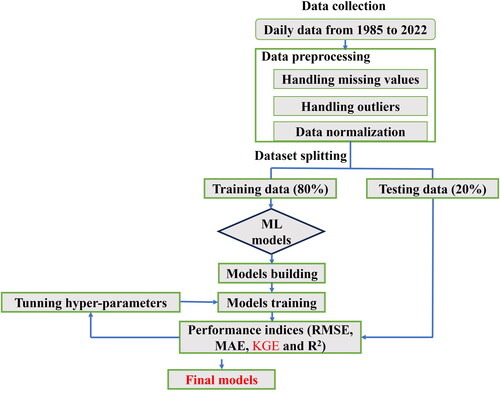
Figure 4. Demonstrate the methodology of the study.
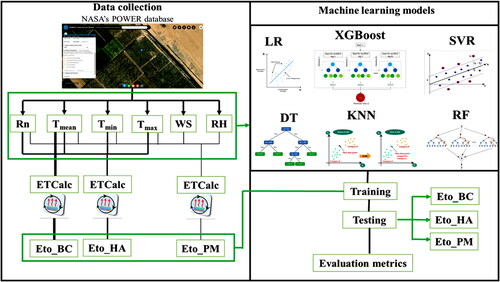
Table 1. Modified Mann-Kendall test and Sen’s slope estimator results of ETo and climate variables on annual scale.
Figure 5. The long period climate values of (A) precipitation (mm), (B) mean temperature (°C), (C) maximum temperature (°C), (D) minimum temperature (°C), (E) wind speed (m/s), (F) relative humidity (%) of study area from (1985–2022).
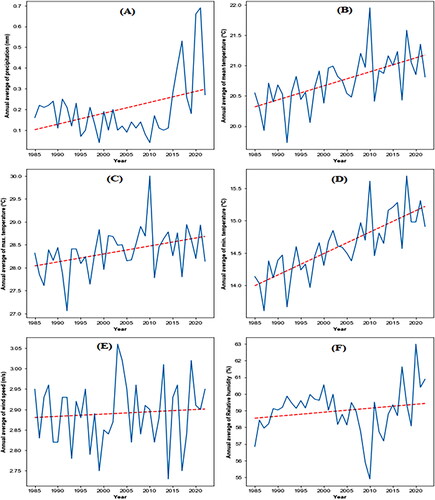
Figure 6. The long period climate values of (A) Extraterrestrial solar radiation (MJ/m2/day), (B) Surface solar radiation (MJ/m2/day), (C) reference evapotranspiration calculated by Penman-Monteith method (PM) (mm), (D) reference evapotranspiration calculated by Hargreaves method (HA) (mm), (E) reference evapotranspiration calculated by Blaney-Criddle method (BC) (mm of study area from (1985–2022).
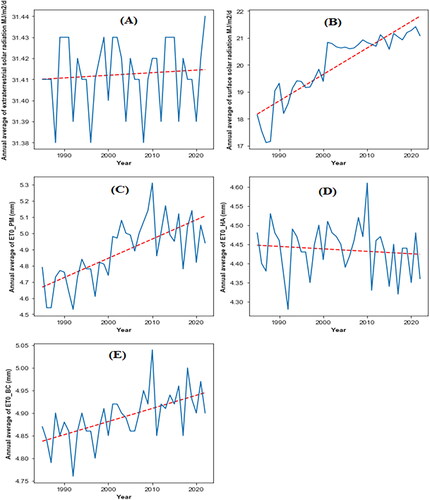
Figure 7. Scatter plots showing.the comparison of predicted.and actual ETo values and their.relationship for (A) Penman-Monteith.method (PM) (mm), (B) by Hargreaves method (HA), and (C) Blaney-Criddle method (BC) during the testing period.
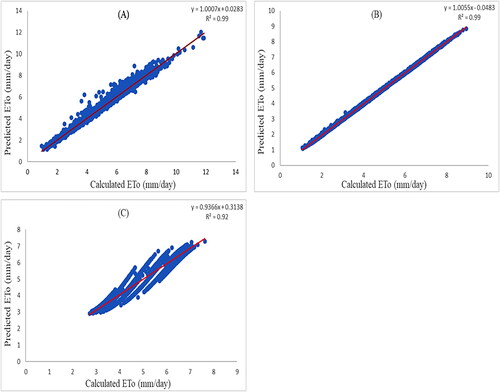
Table 2. Performance parameters for ETo methods using selected algorithms.
Data availability statement
Data that support the findings of this study are available from the corresponding author upon reasonable request.