
Figures & data
Figure 1. The cascading cattle growth and development in Zambia from 1961 to 2022 (FAO, Citation2023a; Zambia Statistics Agency & Ministry of Fisheries & Livestock, Citation2022).
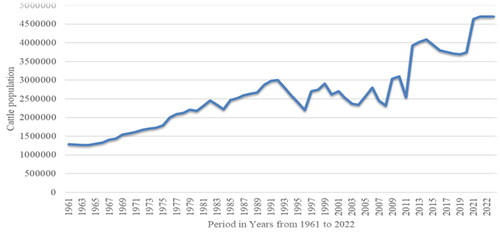
Table 1. Flows of cattle stocks per province (Zambia Statistics Agency & Ministry of Fisheries & Livestock, Citation2022).
Table 2. Smallholder cattle herd configuration by province as of April 30, 2022 (Zambia Statistics Agency & Ministry of Fisheries & Livestock, Citation2022).
Figure 2. The distribution of livestock (cattle) across different regions in Zambia.
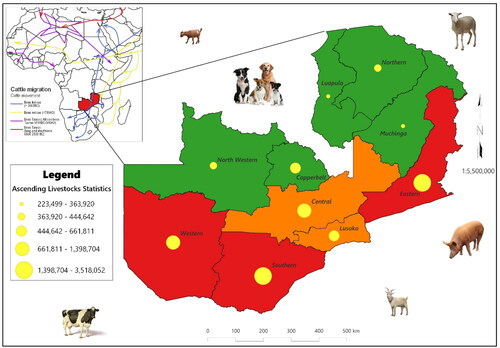
Table 3. The top 40 cattle-producing districts in Zambia’s ten (10) Provinces.
Figure 3. Top 10 districts in Zambia with the highest population of cattle.
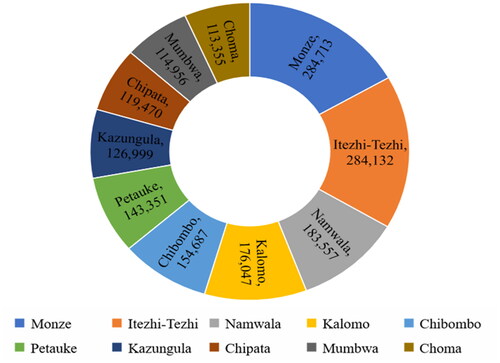
Figure 4. Map of Zambia showing number of veterinary camps per province as of 2022 including 110 (12%) from North-Western (MFL, 2022).
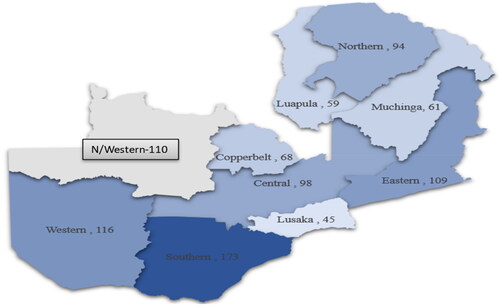
Figure 5. Cattle population distribution for Southern Province (Zambia Statistics Agency & Ministry of Fisheries & Livestock, Citation2022).
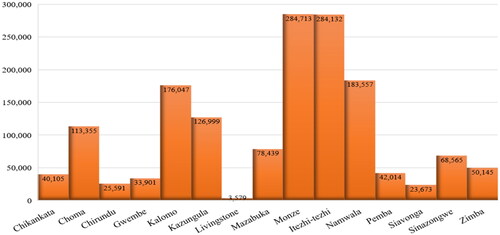
Table 4. Ministry of Fisheries and Livestock (MFL) - 2022 allocations contrasted with releases.
Figure 6. Selected provinces that were declared drought-risk and an emergency by the president of Zambia and the cattle population by sex orientation.
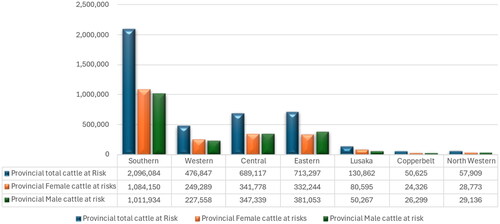
Figure 7. Contrast between intensive livestock feeding system and smallholder farmers associated extensive grazing depending on natural veld.
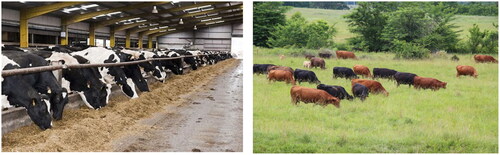
Figure 8. Challenges faced by the Zambian smallholder livestock system.
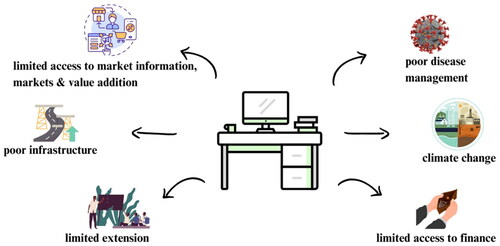
Figure 9. Conceptual Framework for advancing sustainable cattle business system.
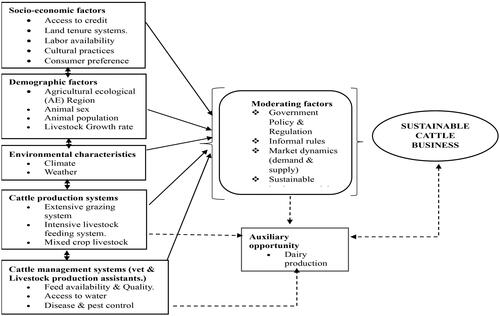
Table 5. Sales of Live Cattle in Households and Establishments (1st May 2022 - 30th April 2022).
Figure 10. Milk production and distribution according to each province in Zambia (Ministry of Fisheries and Livestock, Citation2020; Zambia Statistics Agency & Ministry of Fisheries & Livestock, Citation2022).
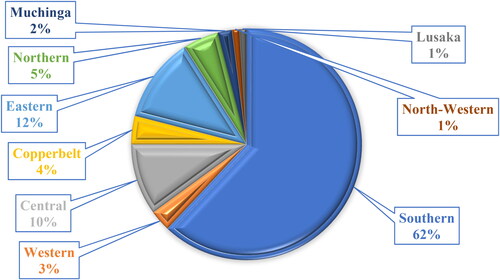
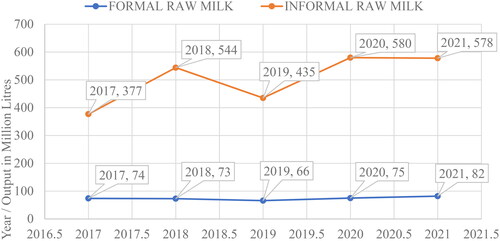
Figure 11. Volume of raw milk being sold in both formal and informal markets from 2017 to 2021.
Data availability statement
Upon reasonable request, the corresponding authors will provide all supplemental files, data generated and analyses.