
Figures & data
Figure 1. Research conceptual framework.
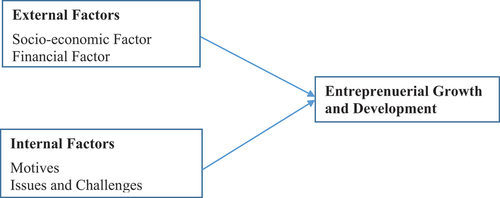
Table 1. Frequency distribution for demographic characteristics of the entrepreneurs in the hospitality sector (n = 250)
Table 2. Independent sample t-test between gender and internal and external factors of entrepreneurs in hospitality sector
Table 3. One way ANOVA between the age group of the respondents and the factors (motives, issues and challenges, government-related problems and strategies) of entrepreneurs in hospitality sector
Table 4. One-way ANOVA between of the level of education of respondents and the factors (motives, issues and challenges, government-related problems and strategies) of entrepreneurs in hospitality sector
Table 5. To influence a research model of small business operators with motives to overcome the challenges and engaging them in hospitality sector is proposed
