
Figures & data
Figure 1. The trend of managerial shareholding rates in the Chinese listed manufacturing sector (2008–2021). Note: The study has used the industry mean value for managerial ownership in this figure.
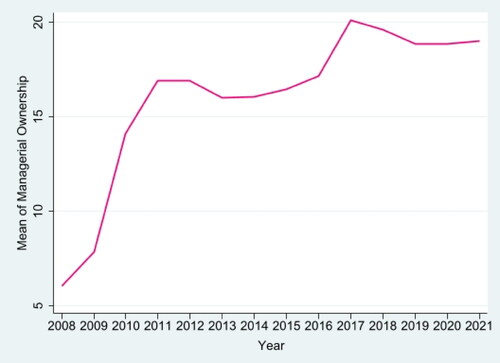
Table 1. Sample distribution.
Table 2. Descriptive statistics.
Table 3. Pearson correlation analysis and variance inflation factor.
Table 4. Benchmark regression results.
Table 5. Robustness check (1).
Table 6. Robustness check (2).
Table 7. Further analysis.
Data availability statement
The data that support the findings of this study are available from the corresponding author upon reasonable request.
