
Figures & data
Figure 1. GB issuance amount in 2022. Prepared by authors based on CBI data.
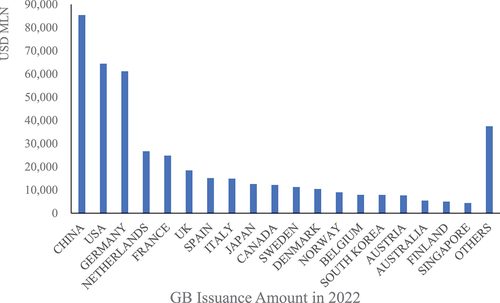
Figure 2. GB issuance in 5 Asian countries and Hong Kong. Prepared by authors based on CBI data.
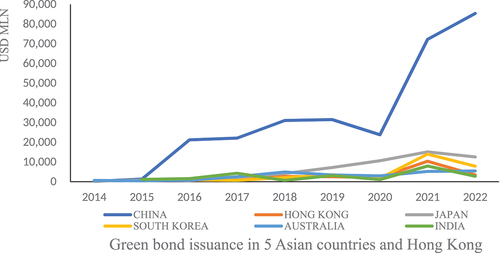
Figure 3. China and its neighboring countries. Prepared by authors.
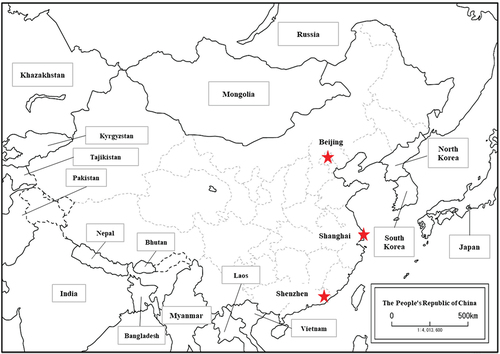
Table 1. Summary of the China interbank bond market transaction amount in 2022
Figure 4. Distribution of Chinese GB issuers in 2021. Prepared by authors based on data on CBI data.
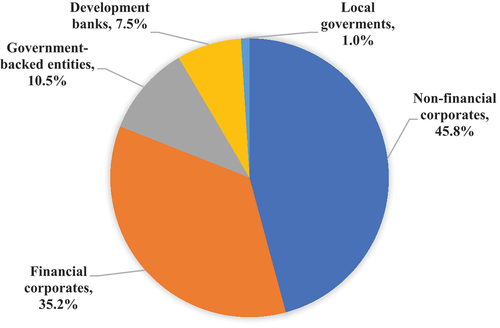
Table 2. Methods and variables in the previous literature
Figure 5. Flowchart of questionnaire survey.
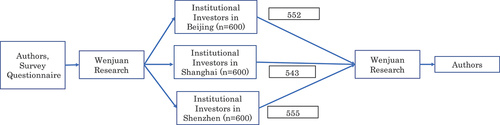
Table 3. The selection of variables
Table 4. Summary of demographic statistics and environmental concerns of survey responses
Table 5. Summary of survey responses for GB investment decision criteria
Table 6. Distributions of the bid responses in Beijing, Shanghai, and Shenzhen
Table 7. Ordered probit regression results
Table 8. The results of the robustness test
