
Figures & data
Figure 1. Research model.
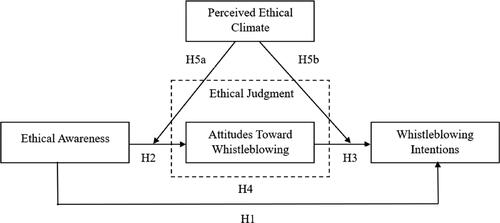
Table 1. Sample selection.
Table 2. Profile of respondents.
Table 3. Measurement of the variables.
Table 4. Results of discriminant validity test using the Fornell-Larcker criterion.
Table 5. Heterotrait-monotrait ratio (HTMT).
Table 6. Results of measurement model’s testing.
Table 7. Descriptive statistics.
Table 8. Results of the structural model’s analysis.
Figure 2. Direct effect test results.
Notes: Output of Warp PLS 7; for variable definition, see .
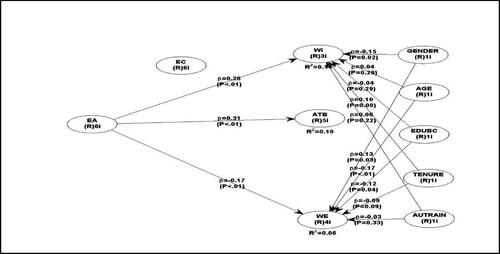
Table 9. Results of hypothesis testing.
Figure 3. Mediating effect test results.
Notes: Output of Warp PLS 7; for variable definition, see .
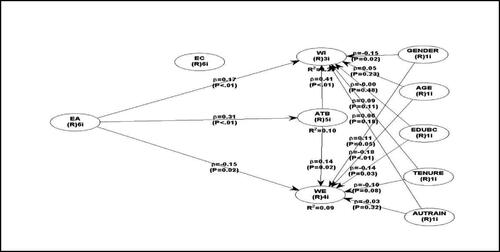
Figure 4. Mediating moderation effect test results.
Notes: Output of Warp PLS 7; for variable definition, see .
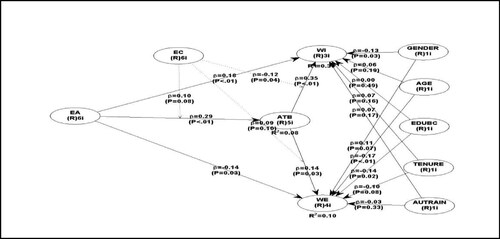
Table 10. Testing of endogeneity and consistent PLS results.
Data availability statement
Data not available – the participants in this study did not give written consent for their data to be shared publicly.
