
Figures & data
Figure 1. Box-Jenkins methodology.
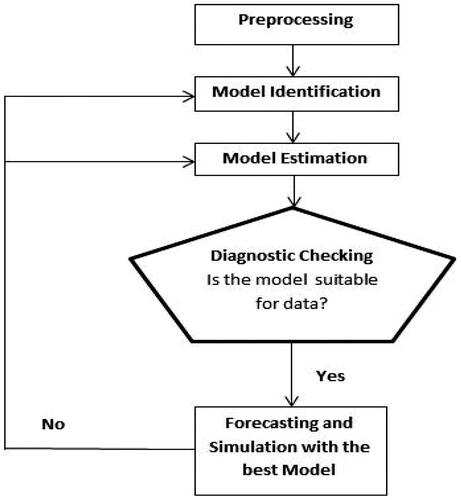
Table 1. Interpretation of MAPE value.
Table 2. Descriptive statistics.
Table 3. Stationarity test.
Table 4. ACF and PACF results.
Table 5. Normality assumptions and white noise assumptions.
Table 6. ARIMA models summary.
Figure 2. Fitting results of static method.
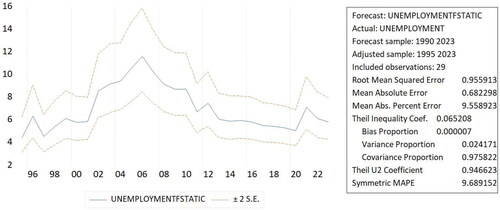
Figure 3. Fitting results for dynamic method.
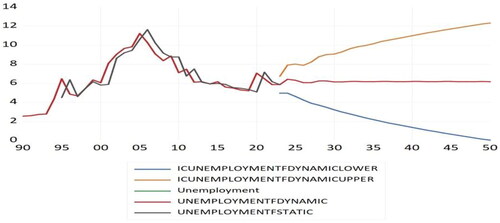
Table 7. The predicted value for unemployment data.
Table 8. The sixteen economic policy packages.
Table 9. The impact of GDP on labor forces based on age groups (1990–2022).
Table 10. The impact of COVID-19 periods on unemployment.
Data availability statement
Data is available upon reasonable request.
