
Figures & data
Figure 1. Flow chart of study selection using Prisma.
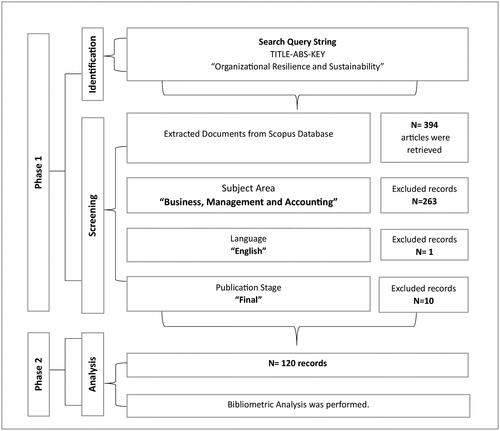
Figure 2. Gradual increase in production.
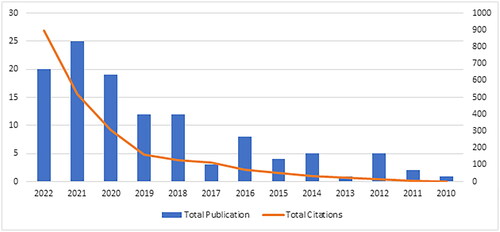
Table 1. Yearly production productivity of the total published documents.
Figure 3. Citation matrix.
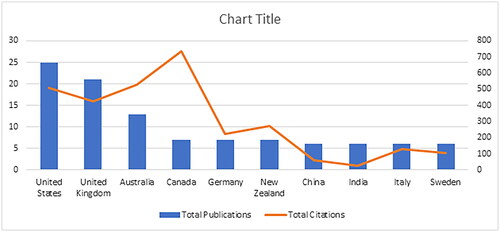
Table 2. Total publication citation and h-index.
Figure 4. Author cited the highest.
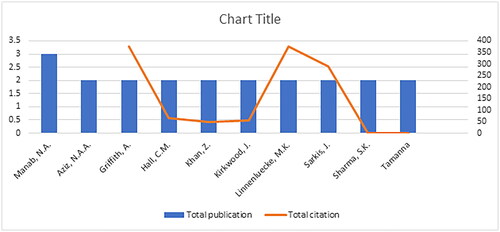
Table 3. Authors with the highest number of publications.
Figure 5. Gradual increase and decrease in citations of affiliations institutes.
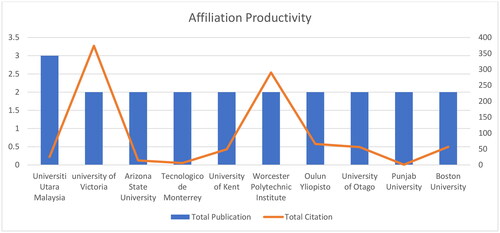
Table 4. Top 10 affiliation institutions with the highest contribution.
Figure 6. Journal with citation details.
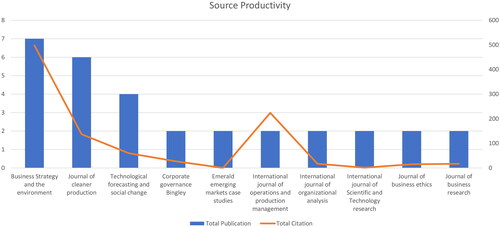
Table 5. Journal with citation details.
Table 6. Top cited title.
Figure 7. Network visualization.
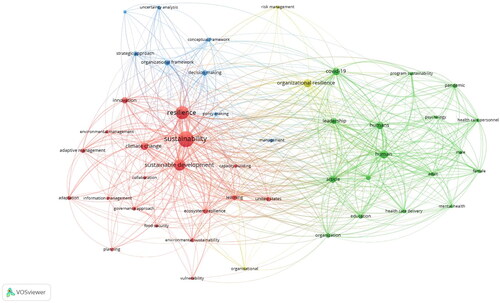
Table 7. Cluster analysis.
Data availability statement
The data set used for this research is from Scopus websites, so they are openly available to access points.
