
Figures & data
Figure 1. Conceptual framework.
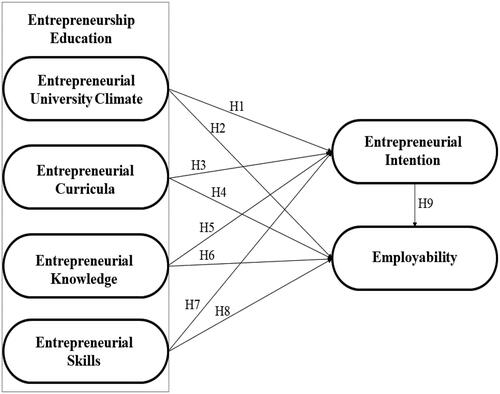
Table 1. Comparative demographics between the population and sample.
Table 2. Demographic Information (n = 397).
Table 3. Technical specifications of the study.
Figure 2. Measurement model.
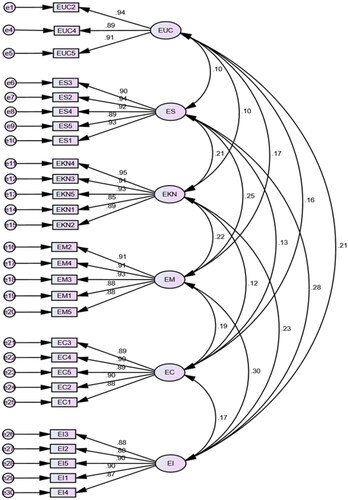
Table 4. Validity and reliability.
Table 5. Standardized regression weights.
Figure 3. Structural equation model.
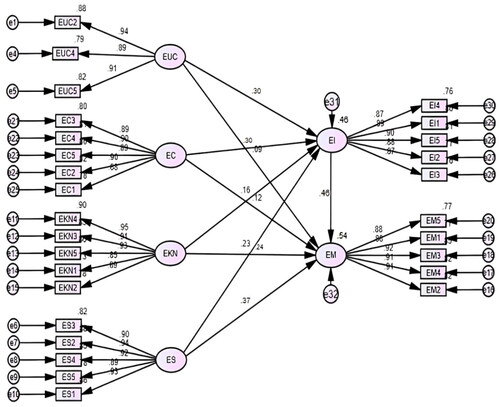
Table 6. Summary of the SEM results.
Table 7. Mediating effects.
Supplemental material
Public Interest Statement.docx
Download MS Word (19.2 KB)Author Biography_.docx
Download MS Word (16.1 KB)Data availability statement
The corresponding author will provide the data upon request.
