
Figures & data
Figure 1. Research Framework.
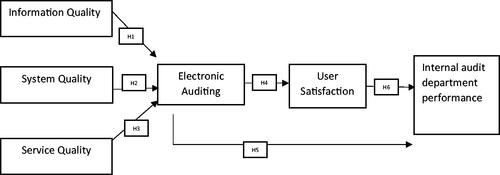
Table 1. Constructs, measurements and their source.
Table 2. Questionnaire delivery and return details.
Table 3. Participants’ characteristics.
Figure 2. Measurement model.
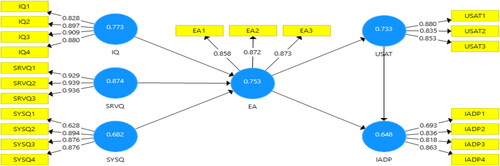
Table 4. Reliability, validity and quality of the measurement model.
Table 5. Cross-loadings.
Table 6. Discriminant validity – Fornell–Larcker criteria.
Table 7. Discriminant validity – HTMT ratios.
Figure 3. Distribution of prediction errors – EA.
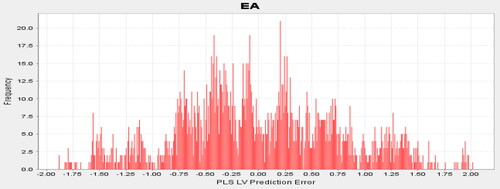
Figure 4. Distribution of prediction errors – USAT.
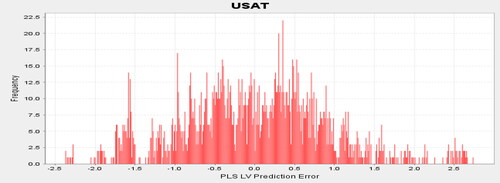
Figure 5. Distribution of prediction errors – IADP.
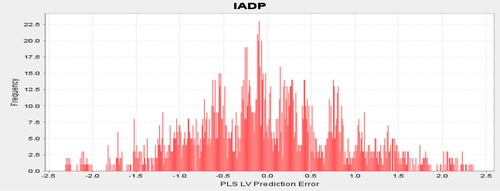
Table 8. PLS predict assessment.
Figure 6. Structural model.
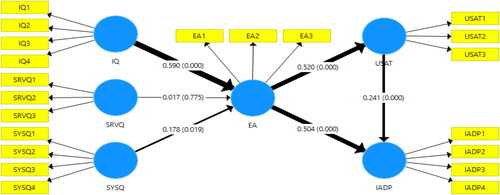
Table 9. Hypotheses testing results.
Table 10. R-squared index.
Table 11. Effect sizes of the latent variables.
Table 12. Predictive relevance.
Table 13. Collinearity diagnostics.
Figure 7. Structural model.
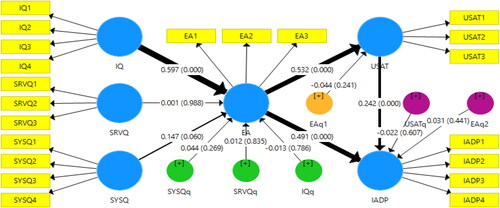
Table 14. Assessment of non-linear/quadratic effects.
Figure 8. IPMA map for EA.
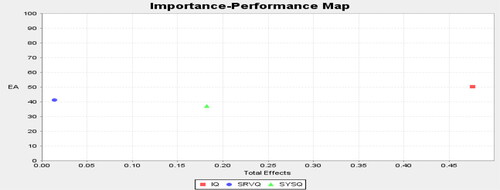
Figure 9. IMPA map for USAT.
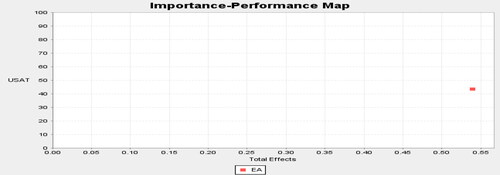
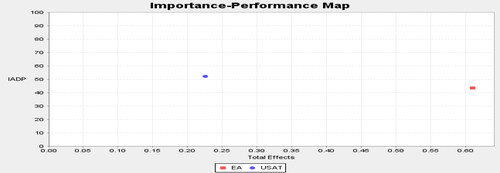
Figure 10. IMPA map for IADP.
Data availability statement
The datasets used during the current study are available from the corresponding author on reasonable request.
